\documentclass[tikz,border=3.14mm]{standalone}
\usepackage{enumitem}
\usetikzlibrary{shapes.geometric}
\usetikzlibrary{shapes.symbols}
\tikzset{database/.style={cylinder,aspect=0.5,draw,rotate=90,path picture={
\draw (path picture bounding box.160) to[out=180,in=180] (path picture bounding
box.20);
\draw (path picture bounding box.200) to[out=180,in=180] (path picture bounding
box.340);
}}}
\newsavebox{\tptable}
\sbox{\tptable}{\tiny{
\begin{tabular}{c c }
\textbf{Symbol} & \textbf{Position} \\
AMZN & 3800 \\
V & 2300 \\
UBER & -500
\end{tabular}
}}
\newsavebox{\lptable}
\sbox{\lptable}{\tiny{
\begin{tabular}{c c }
\textbf{Symbol} & \textbf{Position} \\
AMZN & 5000 \\
V & 1500 \\
UBER & -350
\end{tabular}
}}
\newsavebox{\orderstable}
\sbox{\orderstable}{\tiny{
\begin{tabular}{p{0.5cm}p{0.65cm}p{0.45cm}p{0.5cm}}
\textbf{Symbol} & \textbf{Position} & \textbf{Shares} & {Limit} \\
AMZN & BUY & 200 & 123.45 \\
V & SELL & 50 & 321.23 \\
UBER & SELL & 250 & 145.83
\end{tabular}
}}
\begin{document}
\setlist[itemize]{noitemsep, topsep=2pt}
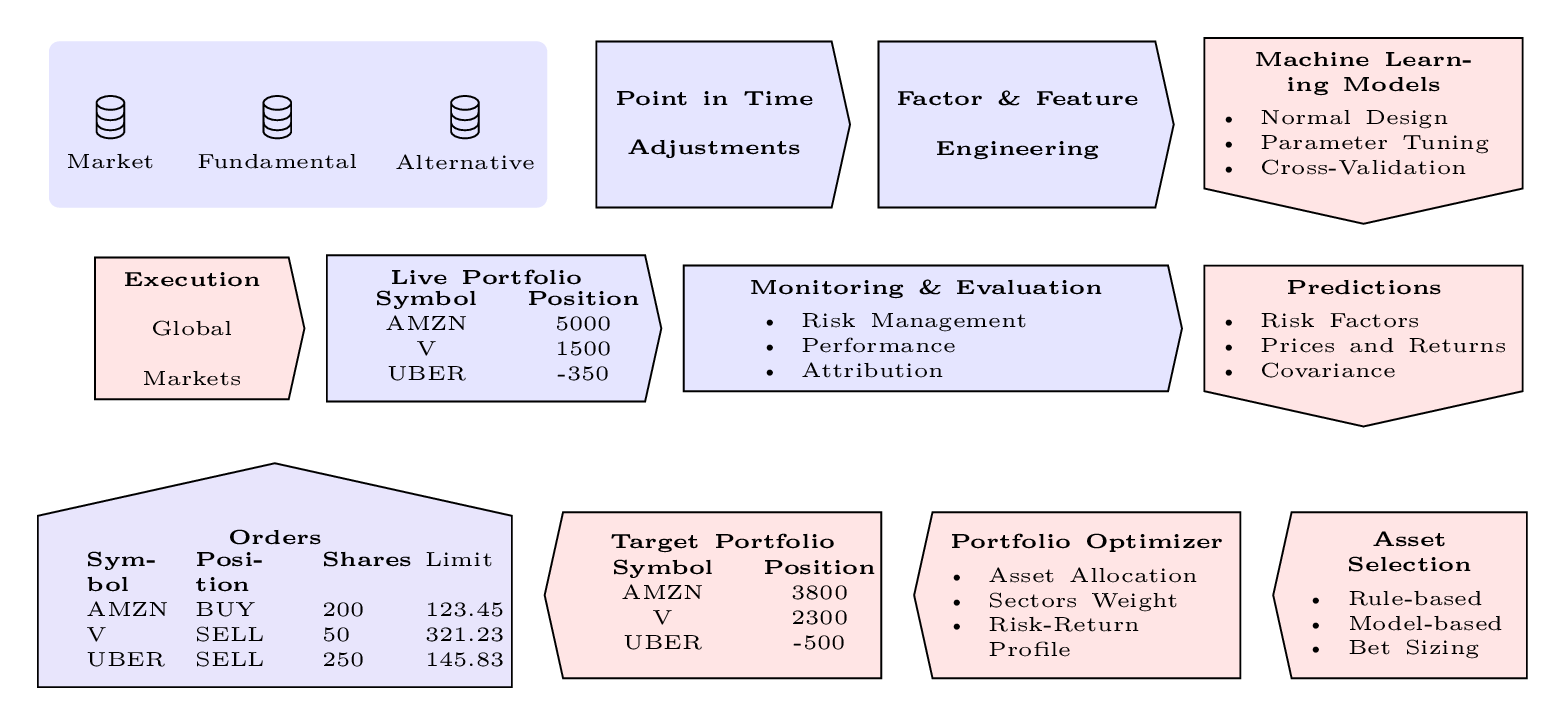
\begin{tikzpicture}
\node[rectangle, rounded corners=0.25em,draw=none, minimum width=12em, minimum height=4em, fill=blue!10] (data_source) {};
\node[database, label={[label distance=0cm]180:\tiny{Market}}] (market) at ([xshift=1.5em] data_source.west) {};
\node[database, label={[label distance=0cm]180:\tiny{Fundamental}}] (fundamental) at ([xshift=-0.5em] data_source) {};
\node[database, label={[label distance=0cm]180:\tiny{Alternative}}] (alternative) at ([xshift=-2.0em] data_source.east) {};
\node[
signal,signal to = east,
fill=blue!10,draw=black,
signal pointer angle=155,
text width=5em,align=center,
font=\color{black}\bfseries,
minimum height=4em
] (pit_adj) at ([xshift=4.0em] data_source.east) {\tiny{Point in Time Adjustments}};
\node[
signal,signal to = east,
fill=blue!10,draw=black,
signal pointer angle=155,
text width=6em,align=center,
font=\color{black}\bfseries,
minimum height=4em
] (ffe) at ([xshift=4.0em] pit_adj.east) {\tiny{Factor \& Feature Engineering}};
\node[
signal,signal to = south,
signal pointer angle=155,
fill=red!10,draw=black,
text width=7em,align=center,
font=\color{black},
minimum height=2em
] (mml) at ([xshift=5.0em, yshift=-1.75em] ffe.north east) {
\tiny{\textbf{Machine Learning Models}}
\tiny{{\begin{itemize}[leftmargin=*]
\item Normal Design
\item Parameter Tuning
\item Cross-Validation
\end{itemize}}}};
\node[
signal,signal to = south,
signal pointer angle=155,
fill=red!10,draw=black,
text width=7em,align=center,
font=\color{black},
minimum height=2em
] (pred) at ([ yshift=-2.5em] mml.south) {
\tiny{\textbf{Predictions}}
\tiny{{\begin{itemize}[leftmargin=*]
\item Risk Factors
\item Prices and Returns
\item Covariance
\end{itemize}}}};
\node[
signal,signal to = east,
signal pointer angle=155,
fill=blue!10,draw=black,
text width=11em,align=center,
font=\color{black},
minimum height=2em,
anchor=east
] (monitor_and_eval) at ([xshift=-0.5em] pred.west) {
\tiny{\textbf{Monitoring \& Evaluation}}
\tiny{{\begin{itemize}[]
\item Risk Management
\item Performance
\item Attribution
\end{itemize}}}};
\node[
signal,signal to = east,
signal pointer angle=155,
fill=blue!10,draw=black,
text width=7em,align=center,
font=\color{black},
minimum height=2em,
anchor=east
] (live_portfolio) at ([xshift=-0.5em] monitor_and_eval.west) {
\tiny{\textbf{Live Portfolio}}
{\usebox{\lptable}}
};
\node[
signal,signal to = east,
signal pointer angle=155,
fill=red!10,draw=black,
text width=4em,align=center,
font=\color{black},
minimum height=2em,
anchor=east
] (execution) at ([xshift=-0.5em] live_portfolio.west) {
\tiny{\textbf{Execution}}
\tiny{Global Markets}
};
\node[
signal,signal to = north,
signal pointer angle=155,
fill=red!10!blue!10,draw=black,
text width=10.75em,align=center,
font=\color{black},
minimum height=2em,
anchor=north
] (orders) at ([xshift=2em, yshift=-1.5em] execution.south) {
\tiny{\textbf{Orders}}
\usebox{\orderstable}
};
\node[
signal,signal to = west,
signal pointer angle=155,
fill=red!10,draw=black,
text width=7em,align=center,
font=\color{black},
minimum height=4em,
anchor=west
] (target_portfolio) at ([xshift=0.75em, yshift=0.15em] orders.east) {
\tiny{\textbf{Target Portfolio}}
\usebox{\tptable}
};
\node[
signal,signal to = west,
signal pointer angle=155,
fill=red!10,draw=black,
text width=6.75em,align=center,
font=\color{black},
minimum height=4em,
anchor=west
] (portfolio_optimizer) at ([xshift=0.75em, yshift=-0em] target_portfolio.east) {
\tiny{\textbf{Portfolio Optimizer}}
\tiny{{\begin{itemize}[leftmargin=*]
\item Asset Allocation
\item Sectors Weight
\item Risk-Return Profile
\end{itemize}}}
};
\node[
signal,signal to = west,
signal pointer angle=155,
fill=red!10,draw=black,
text width=5em,align=center,
font=\color{black},
minimum height=4em,
anchor=west
] (asset_selection) at ([xshift=0.75em, yshift=-0em] portfolio_optimizer.east) {
\tiny{\textbf{Asset Selection}}
\tiny{{\begin{itemize}[leftmargin=*]
\item Rule-based
\item Model-based
\item Bet Sizing
\end{itemize}}}
};
\end{tikzpicture}
\end{document}
