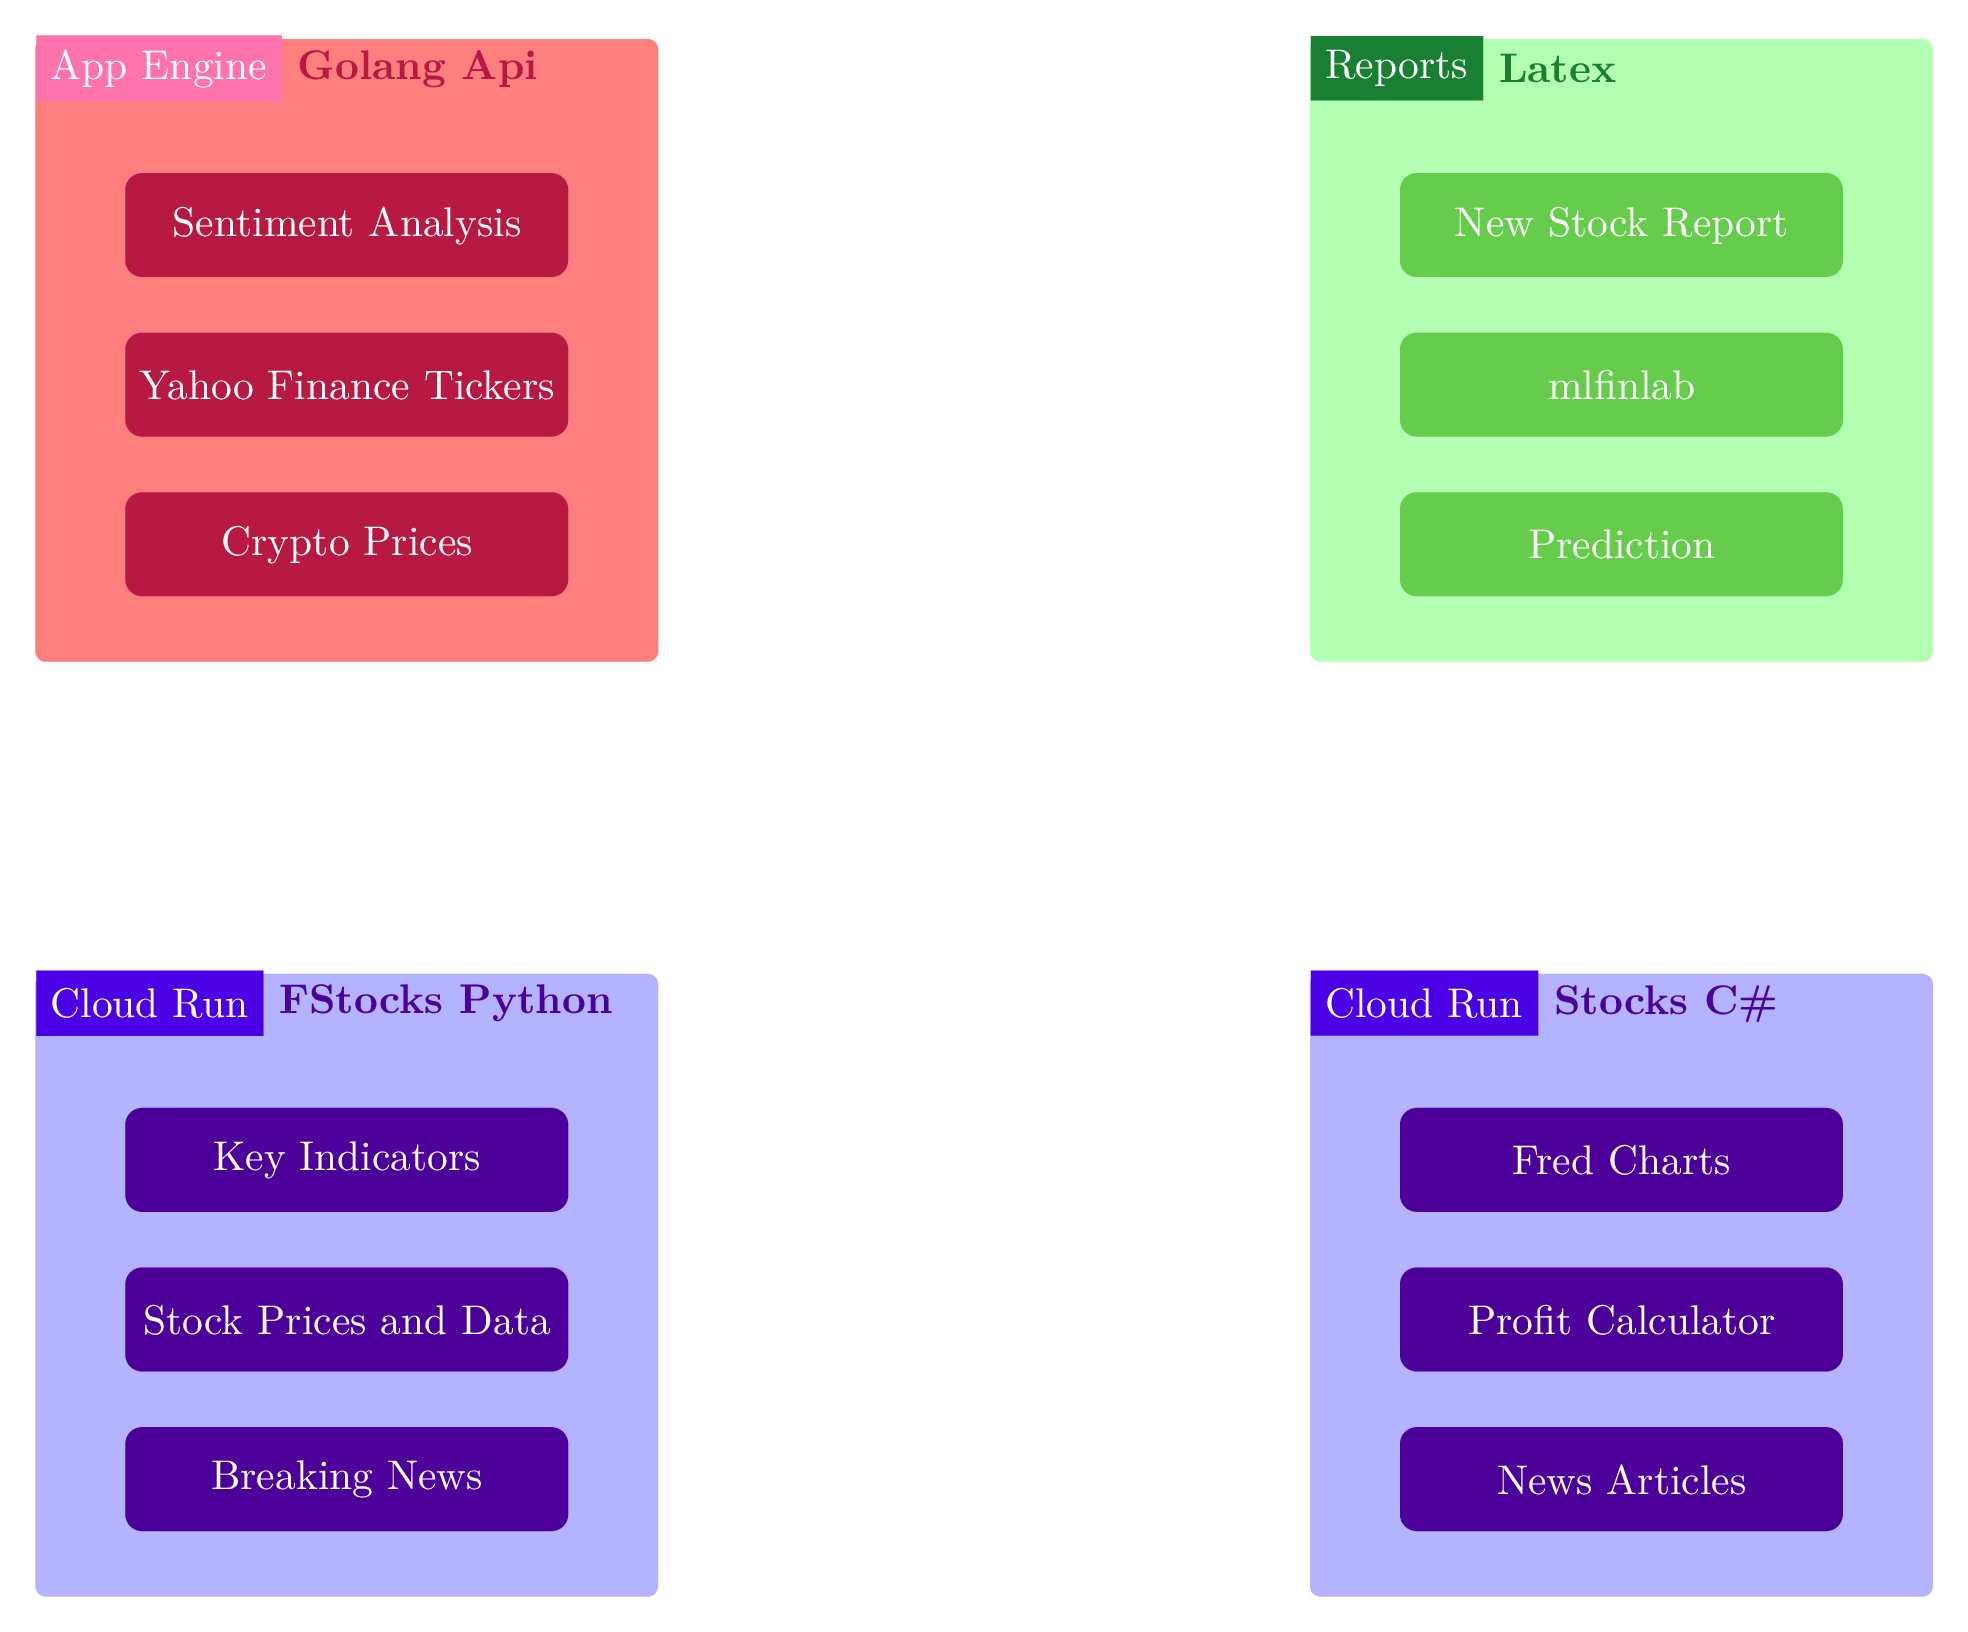
\documentclass[tikz, margin=3mm]{standalone}
\usetikzlibrary{shapes.multipart}
\usetikzlibrary{matrix, fit}
\usetikzlibrary{backgrounds}
\usetikzlibrary{positioning, calc}
\definecolor{cloudrunMain}{rgb}{0.3, 0.0, 0.9}
\definecolor{cloudrunSecond}{rgb}{0.3, 0.0, 0.6}
\definecolor{lightblue}{rgb}{0.68, 0.85, 0.9}
\definecolor{dodgerblue}{rgb}{0.12, 0.56, 1.0}
\definecolor{appengineMain}{rgb}{1.85,0.45,0.68}
\definecolor{appengineSecond}{rgb}{0.72, 0.1, 0.26}
\definecolor{reportsMain}{rgb}{0.1, 0.5, 0.2}
\definecolor{reportsSecond}{rgb}{0.4, 0.8, 0.3}
\usetikzlibrary{fadings, shapes.arrows, shadows,calc}
\tikzset{
sectionHeader/.style args = {#1}{
draw=none,
rectangle split, rectangle split horizontal, rectangle split parts=2,
rectangle split draw splits=false,
align=center, thick,
rectangle split part fill={#1,none}
},
sectionContainer/.style = {
draw,
rectangle,
inner sep=0.3cm,
fill=gray,
minimum height=3cm
},
coloredBox/.style n args={4}{
text centered, fill=#4, minimum width = #1, minimum height= #2, text=white,
text width = #3,
rounded corners
},
}
\begin{document}
\begin{tikzpicture}
\node[draw=none] (stock-arch) {};
\node[rectangle, rounded corners=0.25em,draw=none, minimum width=15em, minimum height=15em, fill=blue!30] (fstocks) at ([xshift=-15em] stock-arch.west) {};
\node[sectionHeader={cloudrunMain}, yshift=-0.725em, anchor=west] (title) at (fstocks.north west) {\nodepart[color=white]{one} Cloud Run
\nodepart{two} \textcolor{cloudrunSecond}{\textbf{FStocks Python}}};
\node[coloredBox={10em}{2.5em}{10em}{cloudrunSecond}, yshift=-4.5em, line width=0.01pt] (fstocks-key) at (fstocks.north) {Key Indicators};
\node[coloredBox={10em}{2.5em}{10em}{cloudrunSecond}, yshift=-1em, below of = fstocks-key, line width=0.01pt] (fstocks-data) {Stock Prices and Data};
\node[coloredBox={10em}{2.5em}{10em}{cloudrunSecond}, yshift=-1em, below of = fstocks-data, line width=0.01pt] (fstocks-news) {Breaking News};
\node[rectangle,rounded corners=0.25em,draw=none, minimum width=15em, minimum height=15em, fill=blue!30] (stocks-app) at ([xshift=15em] stock-arch.east) {};
\node[sectionHeader={cloudrunMain}, yshift=-0.725em, anchor=west] (title) at (stocks-app.north west) {\nodepart[color=white]{one} Cloud Run
\nodepart{two} \textcolor{cloudrunSecond}{\textbf{Stocks C\#}}};
\node[coloredBox={10em}{2.5em}{10em}{cloudrunSecond}, yshift=-4.5em, line width=0.01pt] (stocks-app-data) at (stocks-app.north) {Fred Charts};
\node[coloredBox={10em}{2.5em}{10em}{cloudrunSecond}, yshift=-1em, below of = stocks-app-data, line width=0.01pt] (stocks-app-profit) {Profit Calculator};
\node[coloredBox={10em}{2.5em}{10em}{cloudrunSecond}, yshift=-1em, below of = stocks-app-profit, line width=0.01pt] (stocks-app-news) {News Articles};
\node[rectangle,rounded corners=0.25em,draw=none, minimum width=15em, minimum height=15em, fill=red!50] (gae-server) at ([yshift=15em] fstocks.north) {};
\node[sectionHeader={appengineMain}, yshift=-0.725em, anchor=west] (title) at (gae-server.north west) {\nodepart[color=white]{one} App Engine
\nodepart{two} \textcolor{appengineSecond}{\textbf{Golang Api}}};
\node[coloredBox={10em}{2.5em}{10em}{appengineSecond}, yshift=-4.5em, line width=0.01pt] (gae-server-data) at (gae-server.north) {Sentiment Analysis};
\node[coloredBox={10em}{2.5em}{10em}{appengineSecond}, yshift=-1em, below of = gae-server-data, line width=0.01pt] (gae-server-profit) {Yahoo Finance Tickers};
\node[coloredBox={10em}{2.5em}{10em}{appengineSecond}, yshift=-1em, below of = gae-server-profit, line width=0.01pt] (gae-server-news) {Crypto Prices};
\node[rectangle,rounded corners=0.25em,draw=none, minimum width=15em, minimum height=15em, fill=green!30] (reports) at ([yshift=15em] stocks-app.north) {};
\node[sectionHeader={reportsMain}, yshift=-0.725em, anchor=west] (title) at (reports.north west) {\nodepart[color=white]{one} Reports
\nodepart{two} \textcolor{reportsMain}{\textbf{Latex}}};
\node[coloredBox={10em}{2.5em}{10em}{reportsSecond}, yshift=-4.5em, line width=0.01pt] (reports-new) at (reports.north) {New Stock Report};
\node[coloredBox={10em}{2.5em}{10em}{reportsSecond}, yshift=-1em, below of = reports-new, line width=0.01pt] (reports-mlfinlab) {mlfinlab};
\node[coloredBox={10em}{2.5em}{10em}{reportsSecond}, yshift=-1em, below of = reports-mlfinlab, line width=0.01pt] (reports-prediction) {Prediction};
\end{tikzpicture}
\end{document}
