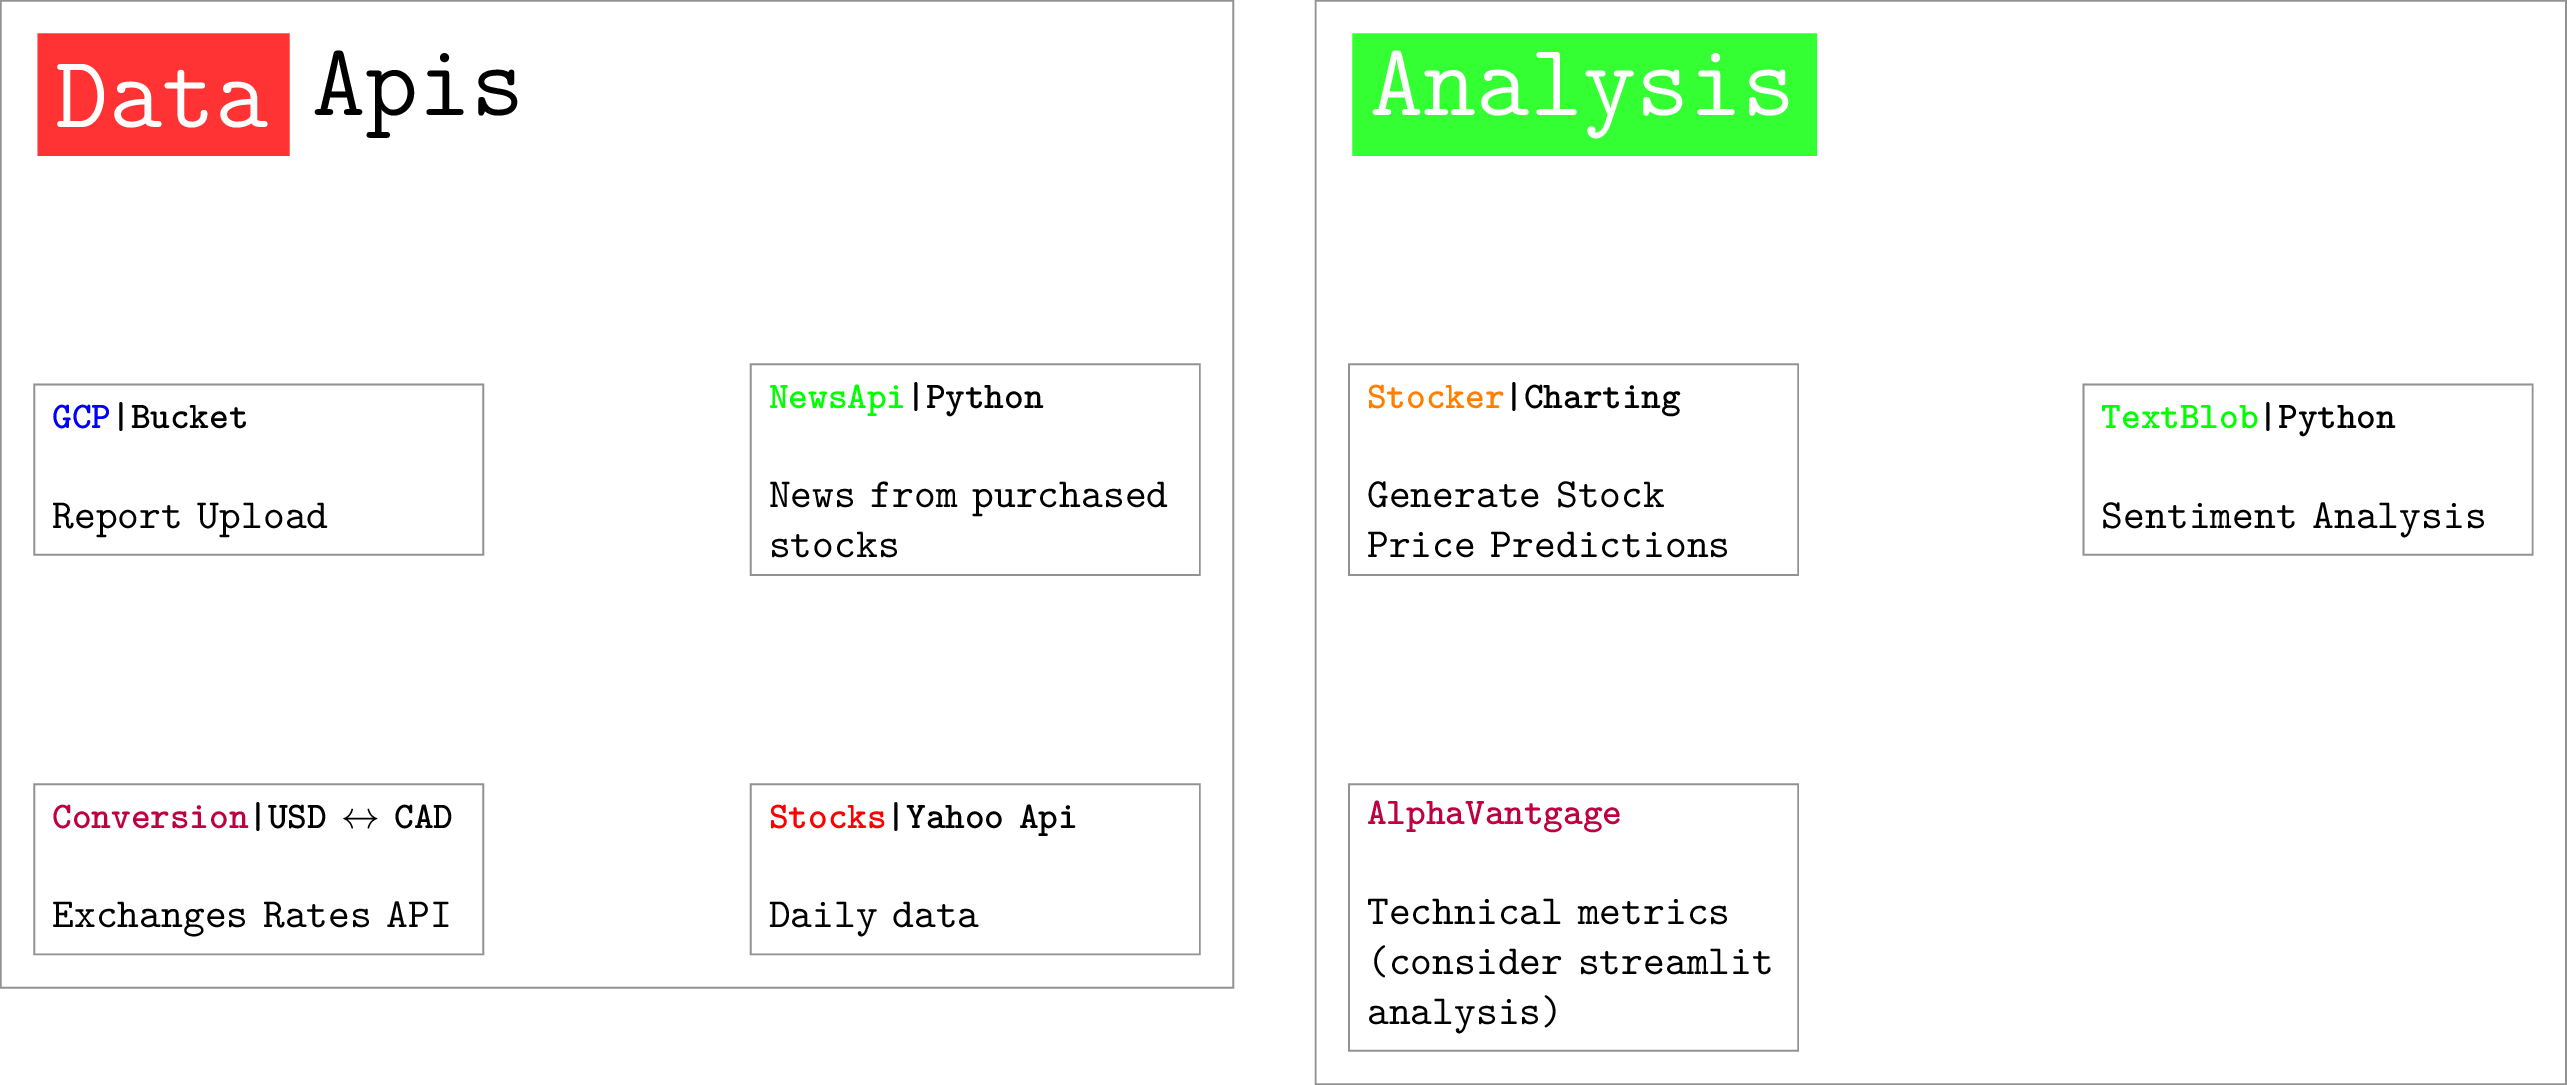
\documentclass{standalone}
\usepackage{tikz}
\usetikzlibrary{shapes.multipart}
\usepackage[default]{lato}
\usepackage[T1]{fontenc}
\usetikzlibrary{matrix, positioning, fit}
\tikzset{
moduleheader/.style args = {#1}{
rectangle split, rectangle split horizontal, rectangle split parts=2,
draw=none,
thick,
line width=2,
rectangle split part fill={#1,white}
}
}
\begin{document}
\begin{tikzpicture}[font=\ttfamily,
mymodule/.style={matrix of nodes, nodes=typetag, row sep=5em, column sep=5em},
mycontainer/.style={draw=gray, inner sep=1ex},
typetag/.style={draw=gray, inner sep=1ex, anchor=west},
title/.style={draw=none, color=gray, inner sep=0pt}
]
\matrix[mymodule] (mx1) {
\node [moduleheader=red!80] (d1)
{ \nodepart[color=white]{one} {\Huge Data}\nodepart{two} {\Huge Apis}}; & \\
\node[draw, text width=3.5cm] (gcp) {
\textbf{\small \textcolor{blue}{GCP}|Bucket} \newline
\newline
Report Upload
}; &
\node[draw, text width=3.5cm] (newsapi) {
\textbf{\small \textcolor{green}{NewsApi}|Python} \newline
\newline
News from purchased stocks
};\\
\node[draw, text width=3.5cm] (yahoo) {
\textbf{\small \textcolor{purple}{Conversion}|USD $\leftrightarrow$ CAD} \newline
\newline
Exchanges Rates API
}; &
\node[draw, text width=3.5cm] (test) {
\textbf{\small \textcolor{red}{Stocks}|Yahoo Api} \newline
\newline
Daily data
}; \\
};
\matrix[mymodule, right=of mx1.north east, matrix anchor=north west] (mx2) {
\node [moduleheader=green!80] (d2)
{ \nodepart[color=white]{one} {\Huge Analysis}\nodepart{two} {}}; & \\
\node[draw, text width=3.5cm] (gcp) {
\textbf{\small \textcolor{orange}{Stocker}|Charting} \newline
\newline
Generate Stock Price Predictions
}; &
\node[draw, text width=3.5cm] (newsapi) {
\textbf{\small \textcolor{green}{TextBlob}|Python} \newline
\newline
Sentiment Analysis
};\\
\node[draw, text width=3.5cm] (yahoo) {
\textbf{\small \textcolor{purple}{AlphaVantgage}} \newline
\newline
Technical metrics (consider streamlit analysis)
}; &
\\
};
\node[mycontainer, fit=(mx1)] {};
\node[mycontainer, fit=(mx2)] {};
\end{tikzpicture}
\end{document}
