Natural Gas Price Analysis with Python
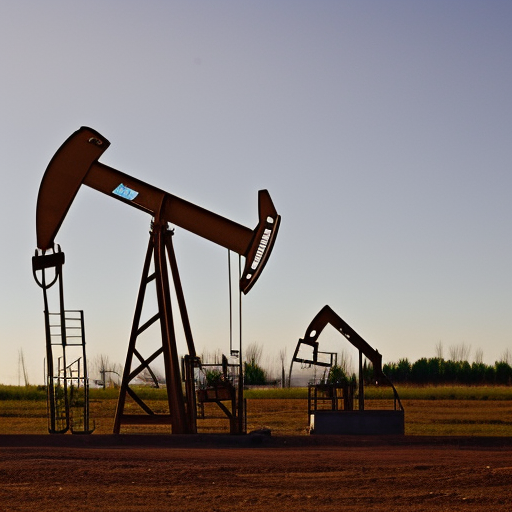
Gas prices fluctuate due to a variety of factors, including changes in the cost of crude oil, which is the primary raw material used to produce gasoline, as well as changes in supply and demand for gasoline, taxes, and other costs associated with refining, storing, and transporting gasoline. Additionally, geopolitical events, such as conflicts or natural disasters, can also affect gas prices by disrupting the global oil market.
Cyclical stocks are stocks that tend to be sensitive to the economic cycle, meaning their prices tend to rise and fall with the overall health of the economy. These stocks are often associated with industries that are heavily influenced by consumer spending, such as retail, consumer durables, and homebuilding.
Cyclical stocks tend to perform well during economic expansions and periods of low unemployment, as consumers have more disposable income to spend on non-essential goods and services. However, during economic downturns and recessions, when consumer spending decreases, the profits and stock prices of companies in cyclical industries tend to decline.
Examples of cyclical stocks include those in the automotive, construction, housing, and consumer discretionary sectors.
A 3-month moving average is a technical indicator that is used to smooth out short-term fluctuations in a stock or index’s price, and to help identify longer-term trends. It is calculated by taking the average of a stock or index’s closing price over the past three months.
The idea behind a moving average is that it helps to filter out “noise” in the stock or index’s price, and to make it easier to spot trends. By averaging out the closing prices over a longer period of time, such as three months, the moving average smooths out any short-term volatility in the stock or index’s price, and makes it easier to identify longer-term trends.
Traders often use moving averages to help identify buy and sell signals. For example, if a stock or index’s price is above its 3-month moving average, it may be considered to be in an uptrend, and traders may buy the stock or index. Conversely, if a stock or index’s price is below its 3-month moving average, it may be considered to be in a downtrend, and traders may sell the stock or index.
 # calculate average from daily data from natural gas futures from yahoo finance
import yfinance
import pandas as pd
import mplfinance as mpf

# read NG=F 2 years worth of data

nat_gas = yfinance.download("NG=F", start="2021-01-01", end="2023-01-01")

nat_gas['Month'] = pd.to_datetime(nat_gas.index)
# pad all date
# print(nat_gas.groupby(by=['Volume', 'Adj Close', pd.Grouper(key='Month', freq='3M')])['Open'].agg('mean'))

mths_3 = pd.date_range(end = nat_gas.index[-1], freq=pd.offsets.BQuarterEnd(),periods=8)
# mths_6 = pd.date_range(end = nat_gas.index[-1], freq=pd.offsets.MonthBegin(6),periods=4)

mth3 = (nat_gas
         #filter for last three months
        .loc[mths_3]
        .groupby(["Month", "Volume"])
        .agg(avg_ng_last_3_months=("Open","mean"))
        )

print(mth3)

# for Bir.to (birchcliff energy, I use the following numbers for some estimations)
# random guess from last two quarters of profit
# at 4.558 assume 360 revenue for Q4 and 160M profit
# 475 revenue and 260M profit for Q4
# considering the investor presentation, thinking its closer to 360M revenue and 160 M profit.
quarterly_profit = 160
# 	266.05M * 0.2
# if deliveries are 3 quarters behind then


quarterly_dividend = 266.05 * 0.2
print(quarterly_dividend)

remaining_revenue = quarterly_profit - quarterly_dividend
print(remaining_revenue)
# 176 debt
total_debt = 176

# max debt reduction (they target to get to 50M USD in debt)
min_debt_reduction = total_debt - 100

print(min_debt_reduction)
# bunch of risk of falling gas prices, but with new supply reduction from russia, doubt it would be so bad.

# save fig
mpf.plot(nat_gas,type='ohlc',mav=(30, 60, 90), volume=True, style='yahoo', savefig='ng.png') 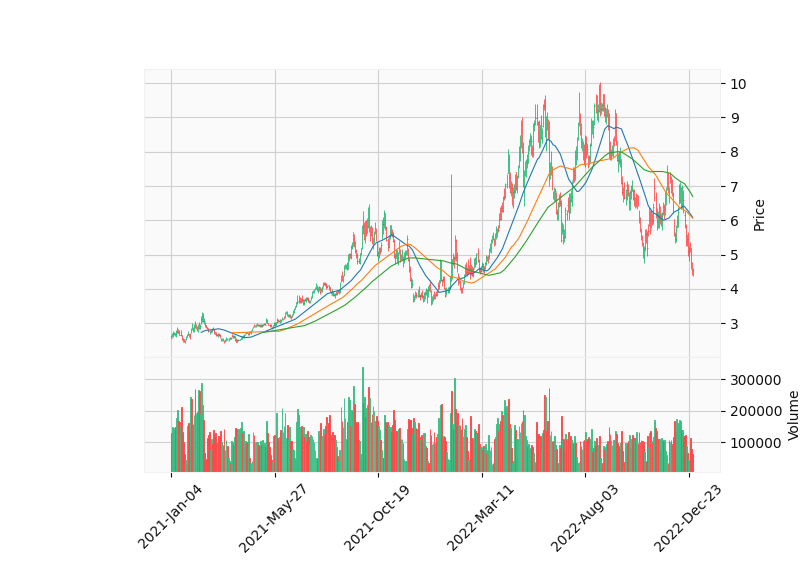
This script appears to be using the yfinance library to download historical data for natural gas futures (NG=F) from Yahoo Finance, for the period between January 1, 2021 and January 1, 2023. It then uses the Pandas library to create a new column in the dataframe called “Month” which is populated with the date of the data point, and converts it to a datetime object.
It then uses the Pandas library to create a date range for the last 8 quarters, and filters the dataframe to only include data points from those quarters. It then groups the data by the “Month” column and the “Volume” column, and calculates the average “Open” value for each group, which it saves to a new column in the dataframe called “avg_ng_last_3_months”.
It also appears to be doing some calculations related to a company’s profit, dividend, and debt, but it’s not clear how these calculations relate to the data being downloaded or how they are being used.
After that it is using mplfinance library to plot Open high low and close prices of natural gas with 30, 60 and 90 moving averages, and volume, and then it’s saving the graph with the name ng.png.
There are several libraries in Python that can be used to create financial plots, including:
- Matplotlib: A widely-used library for creating static, animated, and interactive visualizations in Python. It can be used to create a wide variety of plots, including line plots, scatter plots, bar plots, and candlestick plots.
- Plotly: A library for creating interactive visualizations in Python. It can be used to create a wide variety of plots, including line plots, scatter plots, bar plots, and candlestick plots.
- mplfinance: A library built on top of matplotlib that is specifically designed for financial plotting. It can be used to create a wide variety of financial plots, including candlestick plots, barcharts and volume plots.
- seaborn: A library for creating statistical visualizations in Python. It can be used to create a wide variety of plots, including line plots, scatter plots, bar plots, and heatmaps.
- bokeh: A library for creating interactive visualizations in Python. It can be used to create a wide variety of plots, including line plots, scatter plots, bar plots, and candlestick plots.
All of these libraries have their own strengths and weaknesses, and the best choice will depend on the specific needs of the project. Some are better for creating static plots, while others are better for creating interactive visualizations. Some are better for working with large datasets, while others are better for creating highly customized visualizations.
Most of the libraries mentioned above require a basic understanding of the plotting and visualization concepts, Some of the libraries like mplfinance are built on top of matplotlib and are more specialized to financial plots, making it easier to create charts like candlestick charts and other financial plots.
Climate change is expected to have a significant impact on gas consumption as the world shifts towards cleaner and more sustainable energy sources. As temperatures rise and weather patterns become more extreme, the demand for natural gas is expected to increase in certain sectors such as power generation, as it is considered a cleaner alternative to coal and oil. However, in other sectors such as transportation, the demand for natural gas may decrease as electric vehicles and other alternative fuel vehicles become more prevalent.
The use of natural gas for power generation is expected to increase as countries look to phase out coal and reduce their greenhouse gas emissions. Natural gas is a less carbon-intensive fossil fuel and can be used in combination with renewable energy sources such as wind and solar power to provide a flexible and reliable source of electricity.
However, the transportation sector is also a significant contributor to global greenhouse gas emissions, and there is a growing movement to shift away from fossil fuels and towards electric and alternative fuel vehicles. As a result, the demand for natural gas as a transportation fuel is expected to decrease in the long term.
Overall, the impact of climate change on gas consumption is complex and will depend on a variety of factors, including government policies, technological advancements, and consumer preferences. It’s important to note that natural gas can be used as a transition fuel to decrease the use of coal and oil in power production and make the transition to renewable energy sources.