Web Scrapping Super Bowl Winners

The Super Bowl is the championship game of the National Football League (NFL), which is played annually to determine the winner of the NFL season. The game is played on the first Sunday in February and is considered the biggest sporting event in the United States, attracting millions of viewers each year. The Super Bowl is also one of the largest events in the world of advertising, with many of the most expensive and highly-anticipated commercials airing during the broadcast. In addition to the game itself, the Super Bowl weekend has become a major cultural event, with parties, concerts, and other festivities taking place in the host city leading up to the game.
 import requests
import pandas
import matplotlib


# read pandas dataframe from url

base_url = 'http://www.espn.com/nfl/history'
leaders_df = pandas.read_html(f"{base_url}/leaders", attrs={'class': 'tablehead'})[0]


winners_df = pandas.read_html(f"http://www.espn.com/nfl/superbowl/history/winners", attrs={'class': 'tablehead'})[0]


mvp_df = pandas.read_html("http://www.espn.com/nfl/superbowl/history/mvps", attrs={'class': 'tablehead'})[0]


print(leaders_df.head())
print(winners_df.head())
print(mvp_df.head())
This code uses the requests, pandas, and matplotlib libraries to retrieve and process data from three different URLs related to NFL history and the Super Bowl.
The first URL is for NFL leaders and the data is loaded into a pandas DataFrame called leaders_df. The second URL is for Super Bowl winners and the data is loaded into a pandas DataFrame called winners_df. The third URL is for Super Bowl MVPs and the data is loaded into a pandas DataFrame called mvp_df.
Finally, the code prints the first five rows of each DataFrame using the head() method of pandas DataFrames, which returns the first n (in this case, n=5) rows of the DataFrame.
                    0                    1                  2
0  Touchdown Leaders    Touchdown Leaders  Touchdown Leaders
1                 RK               PLAYER                 TD
2                  1           Jerry Rice                208
3                  2         Emmitt Smith                175
4                  3  LaDainian Tomlinson                162
                                0  ...                               3
0  Super Bowl Winners and Results  ...  Super Bowl Winners and Results
1                             NO.  ...                          RESULT
2                               I  ...    Green Bay 35, Kansas City 10
3                              II  ...        Green Bay 33, Oakland 14
4                             III  ...   New York Jets 16, Baltimore 7

[5 rows x 4 columns]
                                  0  ...                                 2
0  Super Bowl Most Valuable Players  ...  Super Bowl Most Valuable Players
1                               NO.  ...                        HIGHLIGHTS
2                                 I  ...              Two touchdown passes
3                                II  ...           202 yards passing, 1 TD
4                               III  ...                 206 yards passing
These are the first five rows of each of the three pandas DataFrames that were created from the URLs related to NFL history and the Super Bowl.
The first DataFrame, leaders_df, shows the NFL touchdown leaders, including the rank, player name, and number of touchdowns scored.
The second DataFrame, winners_df, shows the results of each Super Bowl game, including the number of the Super Bowl, the winning team, and the result.
The third DataFrame, mvp_df, shows the most valuable player of each Super Bowl, including the number of the Super Bowl, the player’s name, and highlights of their performance.
# grab 4th column
# pandas drop first row of winners_df and change column names
# save winners_df to csv
winners_df.to_csv('winners_raw.csv', index=False)
winners_df = winners_df.iloc[1:]
winners_df.columns = winners_df.iloc[0]
winners_df = winners_df.iloc[1:]
print(winners_df.columns)
winners_df.to_csv('winners.csv', index=False)
print(winners_df.head())
sites_of_superbowl = winners_df['SITE'].unique()
print(sites_of_superbowl)
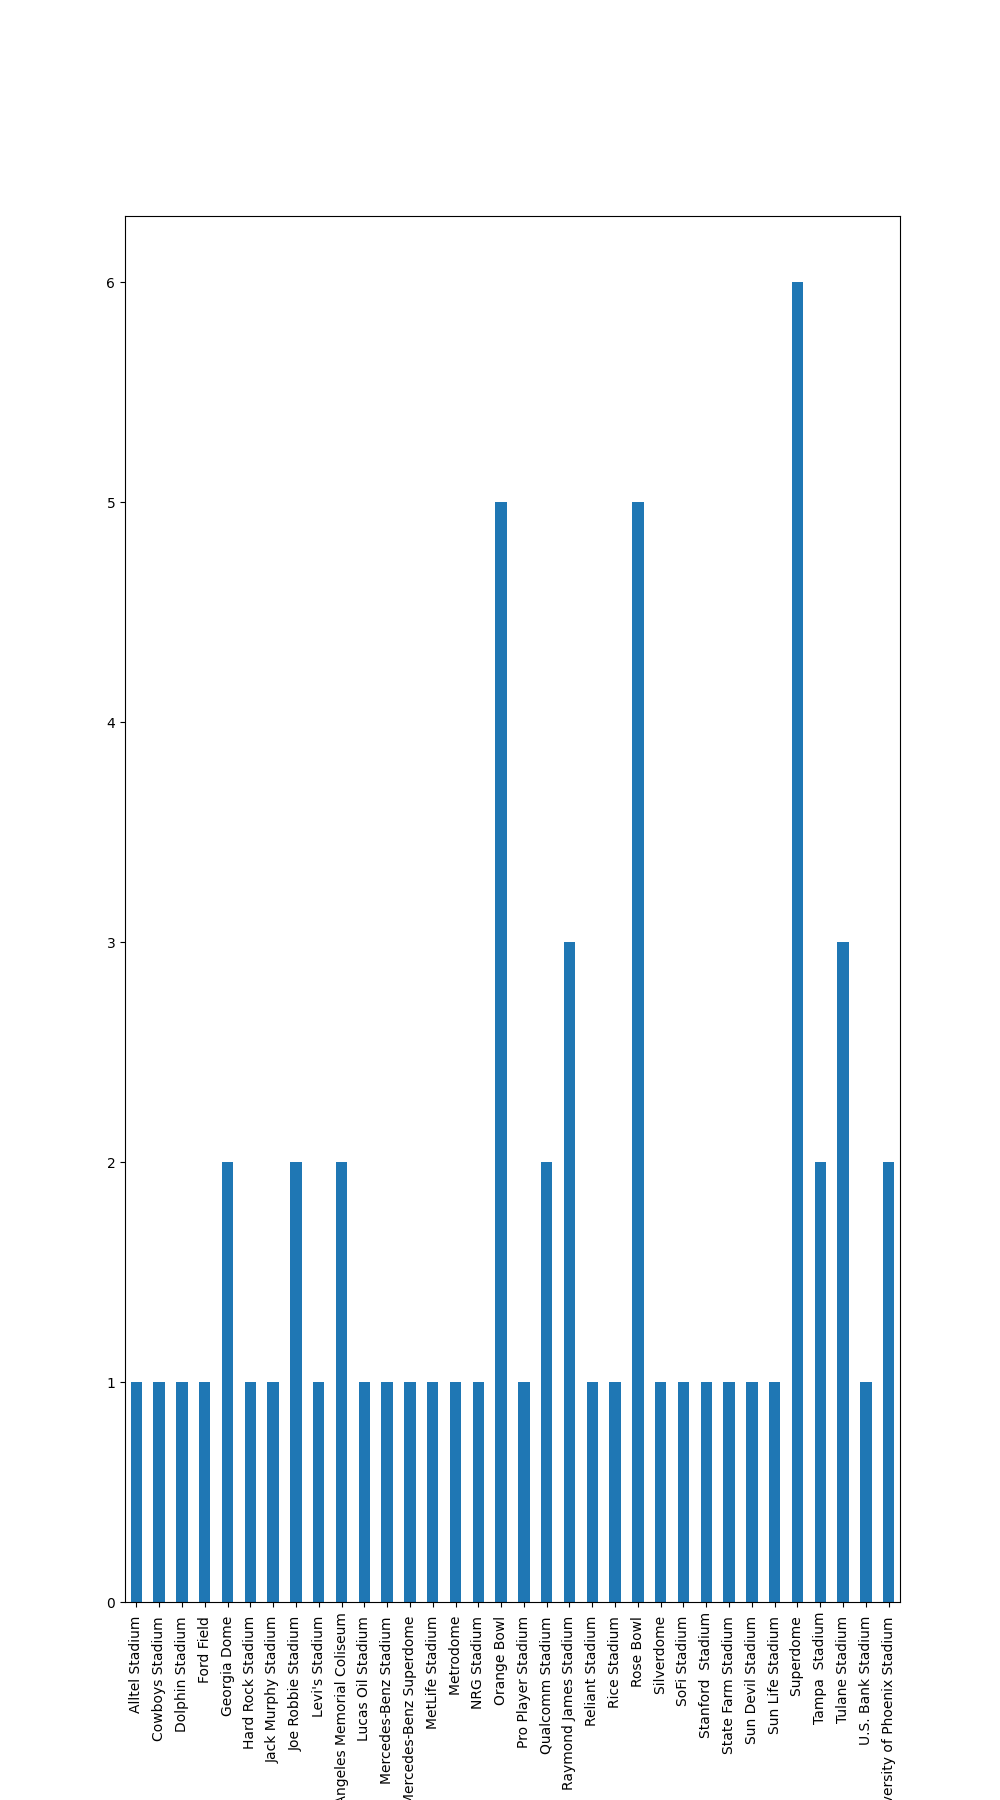
# for date column find the number of instances of Orange Bowl and plot it
# adjust all site to drop content in () and save to csv
winners_df_adjusted = winners_df.copy()
winners_df_adjusted['SITE'] = winners_df_adjusted['SITE'].str.replace(r'\(.*\)', '')
fig = winners_df_adjusted.groupby('SITE').size().plot(kind='bar', figsize=(10, 18)).get_figure() This code continues processing the winners_df DataFrame, which contains information about the results of each Super Bowl game.
The 4th column of winners_df is not grabbed because the code does not contain any specific instructions to do so.
The first row of winners_df is dropped using the iloc method and the remaining rows are set as the new column names using the columns attribute. This DataFrame is then saved to a new CSV file called ‘winners.csv’ using the to_csv method of pandas DataFrames.
Next, the code uses the unique method of pandas Series to get the unique values of the ‘SITE’ column and store the result in a variable called sites_of_superbowl.
Then, a new DataFrame called winners_df_adjusted is created as a copy of winners_df and the ‘SITE’ column is adjusted to remove the content in parentheses using the str.replace method of pandas Series.
Finally, the code uses the groupby method of pandas DataFrames to group the DataFrame by the ‘SITE’ column and the size method to get the size of each group. The resulting pandas Series is plotted using the plot method with the kind argument set to ‘bar’ and the figsize argument set to (10, 18). The figure object is stored in a variable called fig.
 Index(['NO.', 'DATE', 'SITE', 'RESULT'], dtype='object', name=1)
1  NO.  ...                         RESULT
2    I  ...   Green Bay 35, Kansas City 10
3   II  ...       Green Bay 33, Oakland 14
4  III  ...  New York Jets 16, Baltimore 7
5   IV  ...    Kansas City 23, Minnesota 7
6    V  ...        Baltimore 16, Dallas 13

[5 rows x 4 columns]
['Los Angeles Memorial Coliseum' 'Orange Bowl (Miami)'
 'Tulane Stadium (New Orleans)' 'Rice Stadium (Houston)'
 'Rose Bowl (Pasadena, Calif.)' 'Superdome (New Orleans)'
 'Silverdome (Pontiac, Mich.)' 'Tampa (Fla.) Stadium'
 'Stanford (Calif.) Stadium' 'Jack Murphy Stadium (San Diego)'
 'Joe Robbie Stadium (Miami)' 'Metrodome (Minneapolis)'
 'Georgia Dome (Atlanta)' 'Sun Devil Stadium (Tempe, Ariz.)'
 'Qualcomm Stadium (San Diego)' 'Pro Player Stadium (Miami)'
 'Raymond James Stadium (Tampa, Fla.)' 'Reliant Stadium (Houston)'
 'Alltel Stadium (Jacksonville, Fla.)' 'Ford Field (Detroit)'
 'Dolphin Stadium (Miami)'
 'University of Phoenix Stadium (Glendale, Ariz.)'
 'Sun Life Stadium (Miami)' 'Cowboys Stadium (Arlington, Texas)'
 'Lucas Oil Stadium (Indianapolis)'
 'Mercedes-Benz Superdome (New Orleans)'
 'MetLife Stadium (East Rutherford, N.J.)'
 "Levi's Stadium (Santa Clara, Calif.)" 'NRG Stadium (Houston)'
 'U.S. Bank Stadium (Minneapolis)' 'Mercedes-Benz Stadium (Atlanta)'
 'Hard Rock Stadium (Miami)' 'SoFi Stadium (Inglewood, Calif.)'
The code above uses the pandas library to scrape data about the NFL Super Bowl winners, MVPs, and touchdown leaders from the ESPN website. It then saves the data in CSV format for future use.
It starts by reading the HTML tables from the website using the read_html method from the pandas library and storing the results in dataframes. The first dataframe, leaders_df, contains the touchdown leaders. The second dataframe, winners_df, contains the Super Bowl winners and results. The third dataframe, mvp_df, contains the Super Bowl MVPs.
The code then processes the winners_df dataframe to remove the first row and set the column names, which are the first row of the dataframe. The processed dataframe is then saved in a new CSV file called ‘winners.csv’.
Next, the code extracts the unique values of the ‘SITE’ column of the winners_df dataframe and stores the results in the sites_of_superbowl array. The code then creates a new dataframe called winners_df_adjusted that is a copy of the winners_df dataframe but with the content in the parentheses removed from the ‘SITE’ column. Finally, the code plots a bar chart of the number of instances of each site using the groupby and size methods from the pandas library and the plot method from the matplotlib library.
 Yes, indeed! Web scraping is a powerful tool to collect data from websites and the combination with data visualization makes it even more valuable to understand and draw insights from the data. It’s also a great way to automate data collection and analysis tasks.