Polars for pandas users: expressions, lazy frames and group_by
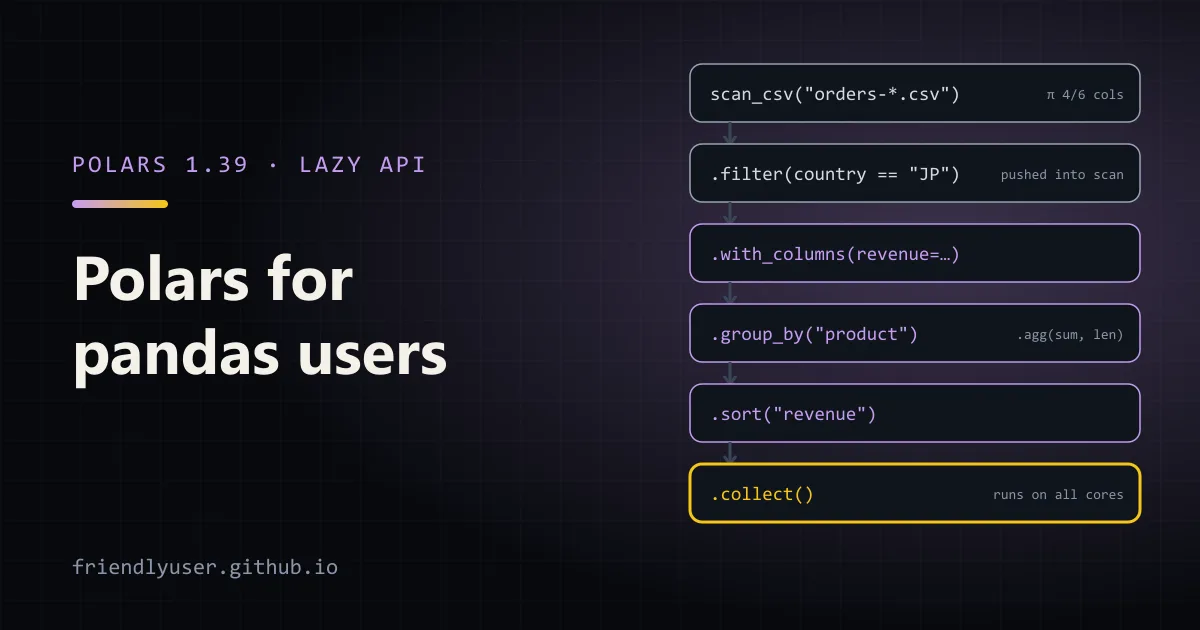
Polars is a DataFrame library written in Rust with a Python API. It runs on all cores, has a query optimizer, and can work on data larger than memory. If you know pandas, most of what you do translates directly, but the style is different: you describe column operations as expressions and let Polars run them, instead of indexing into a frame step by step.
This post shows the same transformations in both libraries so you can map what you already know. Examples use Polars 1.39 and pandas 3.0 on Python 3.13.
pip install polars pandas pyarrow # pyarrow is only needed for to_pandas()/from_pandas()The sample data
Section titled “The sample data”import pandas as pdimport polars as pl
data = { "order_id": [1, 2, 3, 4, 5, 6], "customer": ["ada", "grace", "ada", "linus", "grace", "ada"], "country": ["CA", "US", "CA", "FI", "US", "CA"], "quantity": [2, 1, 4, 1, 3, 1], "unit_price": [79.0, 249.0, 9.5, 189.0, 25.0, 249.0],}pdf = pd.DataFrame(data)df = pl.DataFrame(data)No index
Section titled “No index”The first thing to unlearn. A Polars DataFrame has no index: rows are just rows, in order. That means no .loc, no .iloc for labels, no reset_index(), and no index alignment when you combine frames. Filtering, sorting and joining all produce a fresh, plain frame.
In pandas, a filter keeps the original row labels:
p1 = pdf.assign(total=pdf["quantity"] * pdf["unit_price"])p1 = p1[p1["total"] > 50]print(p1) order_id customer country quantity unit_price total0 1 ada CA 2 79.0 158.01 2 grace US 1 249.0 249.03 4 linus FI 1 189.0 189.04 5 grace US 3 25.0 75.05 6 ada CA 1 249.0 249.0The Polars version:
d1 = ( df.with_columns(total=pl.col("quantity") * pl.col("unit_price")) .filter(pl.col("total") > 50))print(d1)shape: (5, 6)┌──────────┬──────────┬─────────┬──────────┬────────────┬───────┐│ order_id ┆ customer ┆ country ┆ quantity ┆ unit_price ┆ total ││ --- ┆ --- ┆ --- ┆ --- ┆ --- ┆ --- ││ i64 ┆ str ┆ str ┆ i64 ┆ f64 ┆ f64 │╞══════════╪══════════╪═════════╪══════════╪════════════╪═══════╡│ 1 ┆ ada ┆ CA ┆ 2 ┆ 79.0 ┆ 158.0 ││ 2 ┆ grace ┆ US ┆ 1 ┆ 249.0 ┆ 249.0 ││ 4 ┆ linus ┆ FI ┆ 1 ┆ 189.0 ┆ 189.0 ││ 5 ┆ grace ┆ US ┆ 3 ┆ 25.0 ┆ 75.0 ││ 6 ┆ ada ┆ CA ┆ 1 ┆ 249.0 ┆ 249.0 │└──────────┴──────────┴─────────┴──────────┴────────────┴───────┘If you used the index as a key, make it an ordinary column. If you need row numbers, add them with df.with_row_index().
Expressions: pl.col and friends
Section titled “Expressions: pl.col and friends”An expression is a description of a computation on columns. pl.col("quantity") * pl.col("unit_price") doesn’t compute anything by itself. It runs when you pass it to a context:
| Context | What it does | Rough pandas equivalent |
|---|---|---|
select(...) | returns only the listed expressions | df[[...]], or building a new frame |
with_columns(...) | adds or replaces columns, keeps the rest | df.assign(...) |
filter(...) | keeps rows where the expression is true | df[mask], df.query(...) |
group_by(...).agg(...) | one row per group | df.groupby(...).agg(...) |
All expressions inside one context run in parallel, which is part of why Polars is fast without you doing anything. The flip side: inside one with_columns, an expression can’t see a column created by another expression in the same call. Chain a second with_columns for that, as the window example below does.
Some common translations:
# Rename and selectpdf.rename(columns={"unit_price": "price"})[["order_id", "price"]]df.select("order_id", price=pl.col("unit_price"))
# String methodspdf["customer"].str.upper()df.select(pl.col("customer").str.to_uppercase())
# Conditional column: np.where in pandas, when/then/otherwise in Polarsdf.with_columns(    size=pl.when(pl.col("quantity") >= 3).then(pl.lit("bulk")).otherwise(pl.lit("single")))
# Several columns at oncedf.with_columns(pl.col("quantity", "unit_price").cast(pl.Float32))df.select(pl.col(pl.Float64).round(1))   # every Float64 column
Keyword arguments name the output (price=...). The alternative is .alias("price") on the expression.
group_by and agg
Section titled “group_by and agg”pandas uses named aggregation tuples, and the derived column has to exist before grouping:
p2 = ( pdf.assign(total=pdf["quantity"] * pdf["unit_price"]) .groupby("customer", as_index=False) .agg(orders=("order_id", "count"), spent=("total", "sum"), biggest=("total", "max")) .sort_values("spent", ascending=False))In Polars, every aggregation is an expression, so you can compute inside the aggregation:
d2 = ( df.group_by("customer") .agg( orders=pl.len(), spent=(pl.col("quantity") * pl.col("unit_price")).sum(), biggest=(pl.col("quantity") * pl.col("unit_price")).max(), ) .sort("spent", descending=True))print(d2)shape: (3, 4)┌──────────┬────────┬───────┬─────────┐│ customer ┆ orders ┆ spent ┆ biggest ││ --- ┆ --- ┆ --- ┆ --- ││ str ┆ u32 ┆ f64 ┆ f64 │╞══════════╪════════╪═══════╪═════════╡│ ada ┆ 3 ┆ 445.0 ┆ 249.0 ││ grace ┆ 2 ┆ 324.0 ┆ 249.0 ││ linus ┆ 1 ┆ 189.0 ┆ 189.0 │└──────────┴────────┴───────┴─────────┘Two differences to remember:
- Group order isn’t guaranteed. Polars groups in parallel, so the output order can change between runs. Sort afterwards, or pass
maintain_order=True(slower). - The method is
group_by, with an underscore.groupbywas the old name and has been removed.
You can group by an expression, not only a column name: df.group_by(month=pl.col("ordered_at").dt.strftime("%Y-%m")).
Window functions with over
Section titled “Window functions with over”pandas’ groupby(...).transform(...), which returns a value per row rather than per group, becomes .over():
# pandaspdf["total"] = pdf["quantity"] * pdf["unit_price"]pdf["share"] = (pdf["total"] / pdf.groupby("customer")["total"].transform("sum")).round(2)
# Polarsd3 = df.with_columns(    total=pl.col("quantity") * pl.col("unit_price"),).with_columns(    share=(pl.col("total") / pl.col("total").sum().over("customer")).round(2))print(d3.select("order_id", "customer", "total", "share"))
shape: (6, 4)┌──────────┬──────────┬───────┬───────┐│ order_id ┆ customer ┆ total ┆ share ││ --- ┆ --- ┆ --- ┆ --- ││ i64 ┆ str ┆ f64 ┆ f64 │╞══════════╪══════════╪═══════╪═══════╡│ 1 ┆ ada ┆ 158.0 ┆ 0.36 ││ 2 ┆ grace ┆ 249.0 ┆ 0.77 ││ 3 ┆ ada ┆ 38.0 ┆ 0.09 ││ 4 ┆ linus ┆ 189.0 ┆ 1.0 ││ 5 ┆ grace ┆ 75.0 ┆ 0.23 ││ 6 ┆ ada ┆ 249.0 ┆ 0.56 │└──────────┴──────────┴───────┴───────┘Lazy frames: scan_csv and .collect()
Section titled “Lazy frames: scan_csv and .collect()”Everything so far was eager: each method runs immediately, like pandas. Polars also has a lazy API, where you build up a query and nothing runs until .collect(). That gives the optimizer the whole query, so it can:
- read only the columns the query uses (projection pushdown);
- apply filters while reading, so filtered-out rows never reach memory (predicate pushdown);
- combine and reorder steps.
pl.scan_csv (and scan_parquet, scan_ndjson) start a lazy query from files, and df.lazy() turns an existing frame into one. For a bigger example, generate three monthly CSV files of fake orders (60,000 rows):
import randomfrom datetime import datetime, timedeltafrom pathlib import Path
import polars as pl
random.seed(42)Path("data").mkdir(exist_ok=True)prices = {"keyboard": 79.0, "mouse": 25.0, "monitor": 249.0, "cable": 9.5, "dock": 189.0}for month in (1, 2, 3):    start = datetime(2025, month, 1)    products = random.choices(list(prices), k=20_000)    pl.DataFrame({        "order_id": range((month - 1) * 20_000 + 1, month * 20_000 + 1),        "ordered_at": [start + timedelta(minutes=random.randrange(28 * 24 * 60)) for _ in products],        "country": random.choices(["CA", "US", "DE", "JP", "BR"], k=20_000),        "product": products,        "quantity": [random.randint(1, 4) for _ in products],        "unit_price": [prices[p] for p in products],    }).write_csv(f"data/orders-2025-{month:02d}.csv")
Then query all three files lazily:
import polars as pl
lf = (    pl.scan_csv("data/orders-*.csv", try_parse_dates=True)    .filter(pl.col("country") == "JP")    .with_columns(revenue=pl.col("quantity") * pl.col("unit_price"))    .group_by("product")    .agg(pl.col("revenue").sum(), orders=pl.len())    .sort("revenue", descending=True))
print(lf.explain())print(lf.collect())
explain() prints the optimized plan. Read it bottom-up:
SORT BY [descending: [true]] [col("revenue")] AGGREGATE[maintain_order: false] [col("revenue").sum(), len().alias("orders")] BY [col("product")] FROM WITH_COLUMNS: [[(col("quantity").cast(Float64)) * (col("unit_price"))].alias("revenue")] simple π 3/3 ["product", "quantity", ... 1 other column] Csv SCAN [data/orders-2025-01.csv, ... 2 other sources] PROJECT 4/6 COLUMNS SELECTION: [(col("country")) == ("JP")] ESTIMATED ROWS: 62549The scan reads 4 of the 6 columns and applies the country == "JP" filter during the read. The result:
shape: (5, 3)┌──────────┬────────────┬────────┐│ product ┆ revenue ┆ orders ││ --- ┆ --- ┆ --- ││ str ┆ f64 ┆ u32 │╞══════════╪════════════╪════════╡│ monitor ┆ 1.483044e6 ┆ 2406 ││ dock ┆ 1.148742e6 ┆ 2449 ││ keyboard ┆ 487351.0 ┆ 2455 ││ mouse ┆ 149350.0 ┆ 2423 ││ cable ┆ 59413.0 ┆ 2528 │└──────────┴────────────┴────────┘For data larger than RAM, lf.collect(engine="streaming") runs the same plan in batches, and lf.sink_parquet("out.parquet") writes the result to disk without materializing it all.
My rule of thumb: write scripts and pipelines lazily from the start (scan_* … collect()), and use eager frames for interactive poking in a notebook. The code is the same apart from the first and last line.
Moving between the two
Section titled “Moving between the two”pdf_again = df.to_pandas() # needs pyarrowdf_again = pl.from_pandas(pdf)Both convert through Arrow. That makes it practical to use Polars for the heavy part of a pipeline and hand a pandas DataFrame to a library that expects one (a plotting library, scikit-learn, statsmodels).
Gotchas when coming from pandas
Section titled “Gotchas when coming from pandas”- Missing values are
null, for every type.NaNis a separate floating-point value in Polars, andis_null()doesn’t match it; useis_nan()orfill_nan()for those. In pandas,NaNusually doubles as “missing”. - Strict types. Polars won’t silently turn an integer column into floats or objects. A CSV column with a stray
"n/a"fails to parse instead of becomingobject. Usenull_values=["n/a"]on the reader, orschema_overrides. - No in-place mutation. There’s no
df["col"] = ...assignment on a column and noinplace=True. Every operation returns a new frame (cheaply; columns are shared, not copied), so reassign:df = df.with_columns(...). applyis a last resort.map_elementsruns a Python function per value and is slow, just likeapplyin pandas. Look for an expression first; the expressions guide covers most cases.- Row-wise thinking. Polars is happiest with column operations. If you find yourself iterating over rows, there’s almost always a
when/then,over, or join that does it.
Further reading
Section titled “Further reading”- Polars user guide, especially “Coming from pandas”
- Lazy API
- Python API reference
© 2026 David Li · Home · Blog · RSS ·Classic site · Built with Astro, Starlight and three.js · Logos:Font Awesome Free (CC BY 4.0)