Measuring C# performance with BenchmarkDotNet
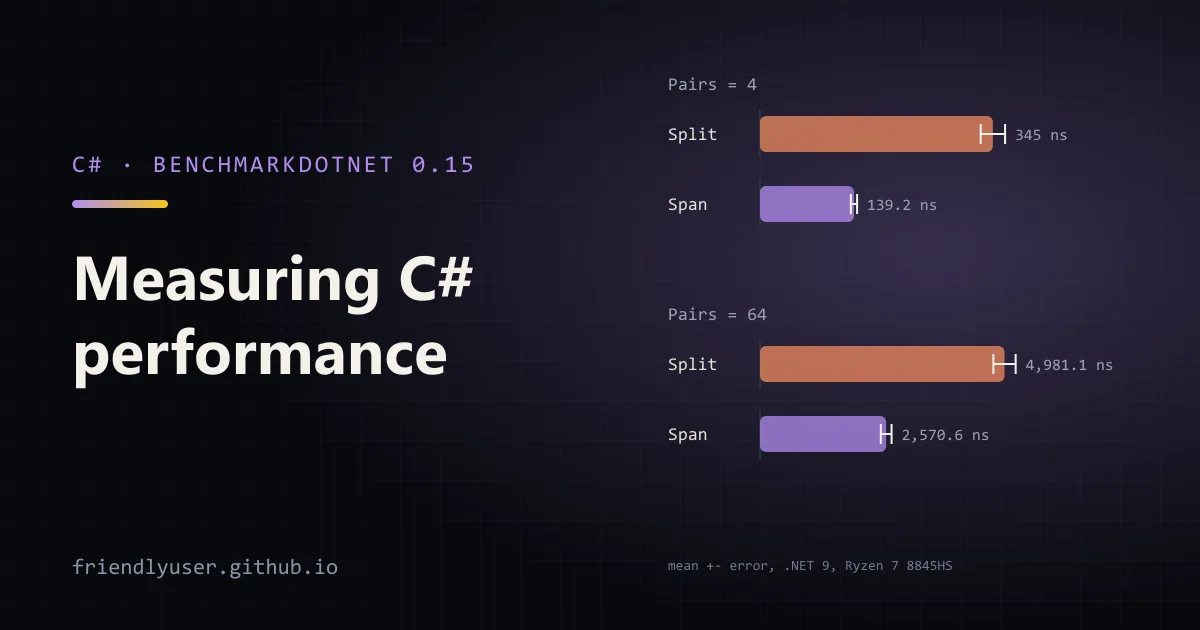
BenchmarkDotNet is the standard library for microbenchmarks in .NET. You mark methods with [Benchmark], and it handles the hard parts: it builds your code in a separate process with optimizations on, warms up the JIT, runs enough iterations to get stable numbers, removes outliers, and reports means with confidence intervals and allocations. The .NET runtime team uses it for their own performance work.
This post builds one benchmark comparing two ways of parsing a string, runs it, and walks through the results table column by column. It uses BenchmarkDotNet 0.15.8. The numbers are from one real run on my machine, described below; yours will differ, and that’s the point of measuring.
Setting up
Section titled “Setting up”A benchmark project is an ordinary console app:
dotnet new console -n ParserBenchmarkscd ParserBenchmarksdotnet add package BenchmarkDotNet --version 0.15.8Keep benchmarks in their own project, not in your test project or the app itself. They need a Release build, their own Main, and they take minutes to run, none of which suits a unit test run.
The benchmark
Section titled “The benchmark”The question: how much does parsing key=value;key=value;... with spans save over string.Split? Replace Program.cs:
using System.Globalization;using System.Text;using BenchmarkDotNet.Attributes;using BenchmarkDotNet.Running;
BenchmarkRunner.Run<ParserBenchmarks>(args: args);
[MemoryDiagnoser]public class ParserBenchmarks{    private string _line = "";
    [Params(4, 64)]    public int Pairs { get; set; }
    [GlobalSetup]    public void Setup()    {        // "k0=0.5;k1=1.5;k2=2.5;..." with Pairs entries        var sb = new StringBuilder();        for (var i = 0; i < Pairs; i++)        {            if (i > 0) sb.Append(';');            sb.Append(CultureInfo.InvariantCulture, $"k{i}={i}.5");        }        _line = sb.ToString();    }
    [Benchmark(Baseline = true)]    public double StringSplit()    {        double total = 0;        foreach (var pair in _line.Split(';'))        {            var parts = pair.Split('=');            total += double.Parse(parts[1], CultureInfo.InvariantCulture);        }        return total;    }
    [Benchmark]    public double SpanSplit()    {        double total = 0;        ReadOnlySpan<char> span = _line;        foreach (Range range in span.Split(';'))        {            ReadOnlySpan<char> pair = span[range];            int eq = pair.IndexOf('=');            total += double.Parse(pair[(eq + 1)..], CultureInfo.InvariantCulture);        }        return total;    }}
What each piece does:
[Benchmark]marks a method to measure. The class and methods must be public.Baseline = truemakesStringSplitthe reference. Every other method in the same group gets aRatiocolumn relative to it.[Params(4, 64)]runs every benchmark once per value, so you see how cost scales with input size. A small and a large value is often enough to spot something that grows faster than you’d expect.[GlobalSetup]runs once per parameter combination, before measuring. Input construction goes here, so it isn’t counted in the time.[MemoryDiagnoser]adds allocation columns. For anything about strings, collections or LINQ, allocations often matter as much as time.- Return the result. Each method returns
total. BenchmarkDotNet consumes return values, so the JIT can’t decide the work is unused and remove it. Avoidbenchmark whose result goes nowhere may end up measuring an empty method.
args: args passes command-line arguments through, which enables filtering such as dotnet run -c Release -- --filter "*SpanSplit*".
Run it in Release
Section titled “Run it in Release”dotnet run -c ReleaseThe -c Release matters. Run in Debug and BenchmarkDotNet refuses:
// * Assembly ParserBenchmarks which defines benchmarks is non-optimizedBenchmark was built without optimization enabled (most probably a DEBUG configuration). Please, build it in RELEASE.Debug builds disable JIT optimizations, so their timings say nothing about production. Also close the debugger, and if you’re on a laptop, plug it in: power-saving modes change CPU clock speeds between runs.
BenchmarkDotNet then generates and builds a separate project from your benchmarks and runs each benchmark case in its own child process: a pilot stage to choose how many operations to run per iteration, overhead measurement, warmup, then the actual iterations. With the default job, this example took a little over five minutes for four benchmark cases.
Reading the results
Section titled “Reading the results”The summary starts with the environment, which you should always include when you share numbers:
BenchmarkDotNet v0.15.8, Windows 11 (10.0.26200.9974/25H2/2025Update/HudsonValley2)AMD Ryzen 7 8845HS w/ Radeon 780M Graphics 3.80GHz, 1 CPU, 16 logical and 8 physical cores.NET SDK 9.0.101 [Host] : .NET 9.0.0 (9.0.0, 9.0.24.52809), X64 RyuJIT x86-64-v4 DefaultJob : .NET 9.0.0 (9.0.0, 9.0.24.52809), X64 RyuJIT x86-64-v4So: a Ryzen 7 8845HS laptop on Windows 11, running .NET 9.0.0, with the JIT using AVX-512-class instructions (x86-64-v4). Then the table:
| Method | Pairs | Mean | Error | StdDev | Median | Ratio | RatioSD | Gen0 | Gen1 | Allocated | Alloc Ratio ||------------ |------ |-----------:|----------:|----------:|-----------:|------:|--------:|-------:|-------:|----------:|------------:|| StringSplit | 4 | 345.0 ns | 18.06 ns | 53.26 ns | 337.9 ns | 1.02 | 0.22 | 0.0753 | - | 632 B | 1.00 || SpanSplit | 4 | 139.2 ns | 4.62 ns | 12.95 ns | 137.6 ns | 0.41 | 0.07 | - | - | - | 0.00 || | | | | | | | | | | | || StringSplit | 64 | 4,981.1 ns | 227.33 ns | 652.27 ns | 4,841.2 ns | 1.02 | 0.18 | 1.1597 | 0.0076 | 9752 B | 1.00 || SpanSplit | 64 | 2,570.6 ns | 109.71 ns | 323.48 ns | 2,468.0 ns | 0.52 | 0.09 | - | - | - | 0.00 |Column by column:
- Mean: the average time per call, after outliers are removed. This is the headline number, but read it together with the next two.
- Error: half the width of the 99.9% confidence interval for the mean. The true mean for
StringSplitwith 4 pairs is very likely within 345.0 ± 18.1 ns. - StdDev: how much individual iterations varied. A standard deviation of 15% or more of the mean, as here, means a noisy run.
- Median: the middle measurement. When it is close to the mean, a few slow iterations aren’t skewing the result.
- Ratio / RatioSD: the mean relative to the baseline, and how much that ratio varied. The baseline’s own ratio isn’t exactly 1.00 because it is computed from the distribution of measurements, not just two means.
- Gen0 / Gen1: garbage collections per 1,000 calls.
StringSplitwith 64 pairs triggers about 1.16 gen-0 collections per thousand calls. - Allocated: managed memory allocated per call.
-means zero. - Alloc Ratio: allocation relative to the baseline.
What this run says: the span version took roughly 40% of the time with 4 pairs and about half with 64, and allocated nothing in either case, against 632 bytes and 9.5 KB for Split. The allocation numbers are exact and won’t change between runs. The time ratios are estimates with visible spread.
Warnings are part of the result
Section titled “Warnings are part of the result”Below the table, this run printed:
// * Warnings *MultimodalDistribution ParserBenchmarks.StringSplit: Default -> It seems that the distribution can have several modes (mValue = 3.09) ParserBenchmarks.SpanSplit: Default -> It seems that the distribution is bimodal (mValue = 3.27)A multimodal distribution means iterations clustered around two or more different times instead of one. Common causes are CPU frequency changes, other processes competing for the CPU, or the work sometimes hitting a slow path, such as a GC. This laptop wasn’t idle during the run, and the high StdDev agrees. The conclusion “spans are about twice as fast here and allocate nothing” survives that noise. A claim like “8% faster” would not. Rerun on a quiet machine before you trust small differences.
The full results are also written to BenchmarkDotNet.Artifacts/results/ as Markdown, CSV and HTML, which is handy for pasting into a pull request.
Useful options
Section titled “Useful options”- Quick runs while iterating:
dotnet run -c Release -- --job shortruns fewer iterations. The results are less precise, but you get them in a fraction of the time. Do the final run with the default job. - Compare runtimes: add several target frameworks to the project (
<TargetFrameworks>net8.0;net9.0</TargetFrameworks>) and run with--runtimes net8.0 net9.0. Each runtime gets its own rows, which answers “did upgrading help this code?” - Per-iteration setup:
[IterationSetup]runs before each iteration rather than once. Avoid it for very fast methods; the docs warn it distorts results for benchmarks under about 100 ms. Prefer setting up state in[GlobalSetup]and copying it inside the benchmark when you need a fresh copy. - Arguments for one method:
[Arguments(...)]on a benchmark method passes values to its parameters, like[Params]but per method.
Gotchas
Section titled “Gotchas”- Microbenchmarks answer narrow questions. A 2x win on a 300 ns method matters only if that method is hot. Profile the real application first (with
dotnet-traceor your IDE’s profiler) to find what’s worth benchmarking. - Keep inputs realistic. A benchmark that parses the same tiny string every time keeps everything in cache. Use
[Params]for sizes that match production, and vary the data if branch prediction could flatter one version. - Don’t benchmark I/O this way. Network or disk calls dominate and vary far more than the code under test. BenchmarkDotNet is for CPU and memory behaviour.
- Check you measure the same thing. Both methods here return the same total. A faster method that skips half the work isn’t faster. A quick assertion in
[GlobalSetup], or a unit test, catches that. - Don’t compare numbers across machines. Ratios against a baseline in the same run travel much better than absolute nanoseconds.
Further reading
Section titled “Further reading”© 2026 David Li · Home · Blog · RSS ·Classic site · Built with Astro, Starlight and three.js · Logos:Font Awesome Free (CC BY 4.0)