Finding slow code in Go with pprof
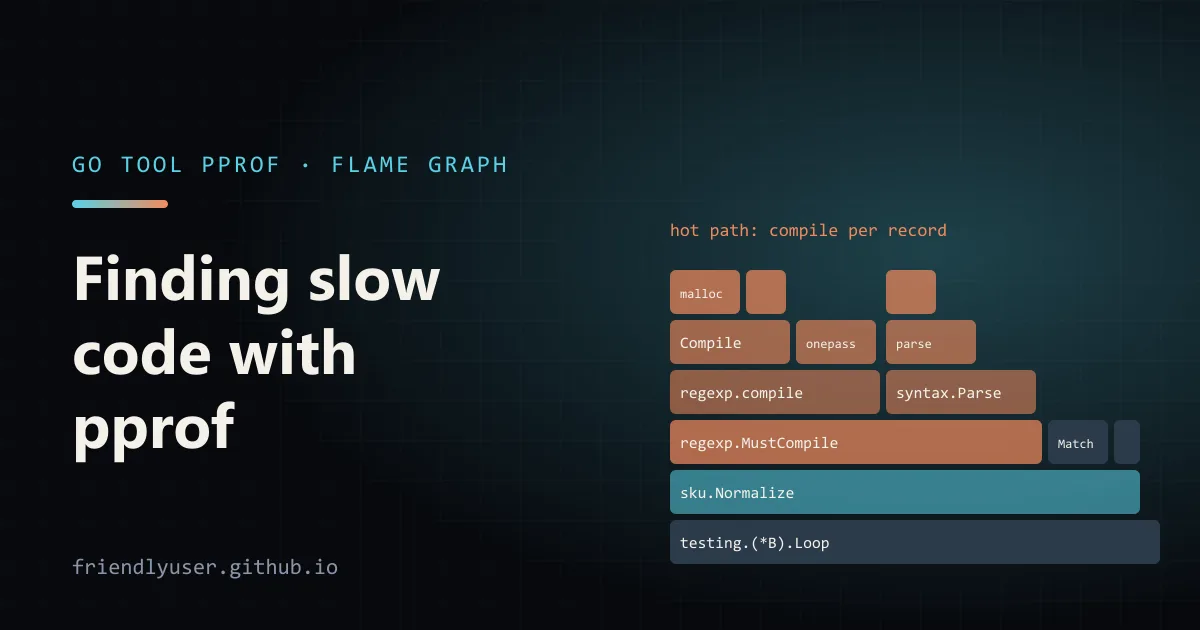
pprof is Go’s built-in profiler. A CPU profile samples the call stack about 100 times a second and tells you where time goes; a memory profile samples allocations and tells you which lines allocate. Both come from the same toolchain you already have: the runtime/pprof and net/http/pprof packages collect profiles, and go tool pprof reads them. The habit worth building is simple: profile before optimising, because the slow part is rarely the part you would have guessed.
Examples use Go 1.27. The allocation counts below were measured with testing.AllocsPerRun on the Go playground.
Two ways to get a profile
Section titled “Two ways to get a profile”From a running service: net/http/pprof
Section titled “From a running service: net/http/pprof”Importing net/http/pprof adds HTTP handlers that produce profiles on demand. The blank import registers them on http.DefaultServeMux, which is a problem if your public server uses the default mux. It is safer to mount the handlers yourself on a separate, private listener:
package main
import (  "log"  "net/http"  "net/http/pprof")
// debugMux serves the pprof endpoints on their own mux, for a private port.func debugMux() *http.ServeMux {  mux := http.NewServeMux()  mux.HandleFunc("/debug/pprof/", pprof.Index)  mux.HandleFunc("/debug/pprof/cmdline", pprof.Cmdline)  mux.HandleFunc("/debug/pprof/profile", pprof.Profile)  mux.HandleFunc("/debug/pprof/symbol", pprof.Symbol)  mux.HandleFunc("/debug/pprof/trace", pprof.Trace)  return mux}
func main() {  go func() {    // localhost only: reach it with SSH port forwarding or kubectl port-forward.    log.Println(http.ListenAndServe("localhost:6060", debugMux()))  }()
  // ... your real server on its own mux and port ...  select {}}
pprof.Index serves the index page and every named profile under /debug/pprof/<name>: heap, allocs, goroutine, block, mutex, threadcreate, and since Go 1.27 goroutineleak. Even with your own mux, importing the package still registers the handlers on http.DefaultServeMux, so never serve the default mux on a public port in a program that imports it.
Then point go tool pprof at it:
# 30-second CPU profile, opened in the interactive shellgo tool pprof "http://localhost:6060/debug/pprof/profile?seconds=30"
# What is in memory right nowgo tool pprof http://localhost:6060/debug/pprof/heap
# Save a profile to analyse later or attach to an issuecurl -o cpu.pprof "http://localhost:6060/debug/pprof/profile?seconds=30"
The CPU endpoint profiles for the requested number of seconds, so generate realistic load while it runs. An idle server gives an empty profile.
From a benchmark: go test
Section titled “From a benchmark: go test”For a specific function, a benchmark gives cleaner data than a live service. go test writes profiles directly:
go test -bench=Normalize -benchmem -cpuprofile=cpu.out -memprofile=mem.outThis also leaves the compiled test binary (<package>.test) in the current directory. You don’t usually need to pass it to pprof, since profiles carry their symbol names, but it lets disasm show machine code.
Reading a profile
Section titled “Reading a profile”go tool pprof cpu.out opens an interactive shell. Three commands cover most sessions:
toplists the functions with the most samples.flatis time spent in the function itself;cum(cumulative) includes everything it called.top -cumsorts by cumulative time, which shows the expensive call paths from your code down, rather than leaf runtime functions such asmallocgc.list Normalizeprints the source of every function matching the regular expression, with flat and cumulative time next to each line. This is the command that points at the line to change.
For a visual view, start the web UI:
go tool pprof -http=localhost:8081 cpu.outSince Go 1.26 it opens on the flame graph. Each bar is a function, its width is its share of samples, and its children sit on top of it. Look for wide bars that belong to your code or to library calls you didn’t expect. The graph view is still under View > Graph, and View > Source is the browser version of list.
Heap versus allocs
Section titled “Heap versus allocs”Memory profiles record four numbers for each allocation site, and which one you look at changes the answer:
| Sample index | Meaning | Use it for |
|---|---|---|
inuse_space | bytes allocated and not yet freed | memory leaks, high RSS |
inuse_objects | objects not yet freed | the same, by count |
alloc_space | bytes allocated since the program started | GC pressure, hot allocation sites |
alloc_objects | objects allocated since start | the same, by count |
/debug/pprof/heap opens with inuse_space and /debug/pprof/allocs opens with alloc_space; they are the same data with different defaults. Switch with -sample_index:
go tool pprof -sample_index=alloc_space mem.outFor a benchmark, inuse_space is nearly empty, because everything the benchmark allocated is garbage by the time the profile is written. Use alloc_space or alloc_objects there. For a service whose memory keeps growing, use inuse_space and compare two heap profiles taken some minutes apart with -diff_base=before.pprof.
A worked example: a hot allocation
Section titled “A worked example: a hot allocation”This function cleans up a list of product codes, keeping only those that look like ABC-1234:
package sku
import (  "regexp"  "strings")
func Normalize(records []string) []string {  var out []string  for _, r := range records {    s := strings.ToUpper(strings.TrimSpace(r))    if regexp.MustCompile(`^[A-Z]{3}-\d{4}$`).MatchString(s) {      out = append(out, s)    }  }  return out}
And a benchmark in sku_test.go, using b.Loop (Go 1.24+), which keeps the setup before the loop out of the timing:
package sku
import (  "fmt"  "testing")
func makeInput(n int) []string {  in := make([]string, n)  for i := range in {    if i%10 == 0 {      in[i] = "not a sku"    } else {      in[i] = fmt.Sprintf(" abc-%04d ", i)    }  }  return in}
func BenchmarkNormalize(b *testing.B) {  input := makeInput(1000)  for b.Loop() {    Normalize(input)  }}
Run it with the profiling flags from above, then open the CPU profile with go tool pprof -http=localhost:8081 cpu.out. What to look for in the flame graph: how much of the Normalize bar is taken by regexp.MustCompile and the regexp compiler functions above it, compared with MatchString. Compiling a regular expression parses it and builds a program, which costs far more than matching an eight-character string, and this code does it once per record. list Normalize shows which line the cumulative time belongs to, and the memory profile with -sample_index=alloc_space points at the same line.
The fix is to compile once, at package level, and to size the result slice up front since its maximum length is known:
var skuPattern = regexp.MustCompile(`^[A-Z]{3}-\d{4}$`)
func Normalize(records []string) []string {  out := make([]string, 0, len(records))  for _, r := range records {    s := strings.ToUpper(strings.TrimSpace(r))    if skuPattern.MatchString(s) {      out = append(out, s)    }  }  return out}
Both versions return the same 900 codes for this input. Measured with testing.AllocsPerRun on Go 1.27 (amd64), one call over 1,000 records went from about 61,000 allocations (about 4.9 MB) to 1,001 allocations (about 26 KB). The remaining 1,000 are one per record from strings.ToUpper, which has to build a new string whenever the input has lowercase letters, plus the one result slice. Run the benchmark again with -benchmem and compare the ns/op, B/op and allocs/op columns on your own machine; benchstat from golang.org/x/perf will tell you whether a timing difference is real or noise across several runs.
Is it worth removing the last 1,000? Only if a profile of the real workload says so. In the flame graph after the fix, Normalize should be a small part of the request, and the next widest bar is the next thing to look at.
Other profiles worth knowing
Section titled “Other profiles worth knowing”- goroutine: a stack trace of every goroutine.
?debug=2gives the full dump as text, which is the fastest way to see what a stuck service is waiting on. - goroutineleak (Go 1.27): goroutines blocked on a channel or lock that nothing can ever unblock, found by the garbage collector’s reachability analysis. Leaks reachable from global variables or from running goroutines can be missed, so treat an empty profile as “none found”, not “none exist”.
- block and mutex: where goroutines wait on channels and locks, and which locks are contended. Both are off by default; enable them with
runtime.SetBlockProfileRateandruntime.SetMutexProfileFraction, since they add overhead. - trace (
/debug/pprof/trace?seconds=5, read withgo tool trace): an execution trace of scheduling, GC and syscalls over time. Use it for latency problems that a CPU profile averages away.
Gotchas
Section titled “Gotchas”- CPU profiles measure CPU, not waiting. A handler that spends 900 ms waiting for a database and 5 ms computing barely shows up. Use tracing (or the block profile) for latency.
- Profile realistic work. A benchmark over a tiny input can make the wrong code look hot. Use inputs shaped like production data.
- Inlining moves lines. Small functions get inlined into their callers, so
listmay attribute time to the caller’s line.-gcflags=-ldisables inlining if you need exact attribution, but don’t benchmark with it. - Keep the endpoints private. Profiles reveal source paths, command-line arguments and performance characteristics, and the CPU endpoint costs CPU while it runs.
- Use the profile twice. A CPU profile from production, saved as
default.pgoin the main package directory, enables profile-guided optimisation on the nextgo build(Go 1.21+).
Further reading
Section titled “Further reading”- Diagnostics (official overview of profiling, tracing and debugging)
- Profiling Go Programs (Go blog)
net/http/pprofandruntime/pprof- pprof README, which documents every command and option
- Profile-guided optimization
© 2026 David Li · Home · Blog · RSS ·Classic site · Built with Astro, Starlight and three.js · Logos:Font Awesome Free (CC BY 4.0)