Kubernetes Liveness, Readiness and Startup Probes Explained
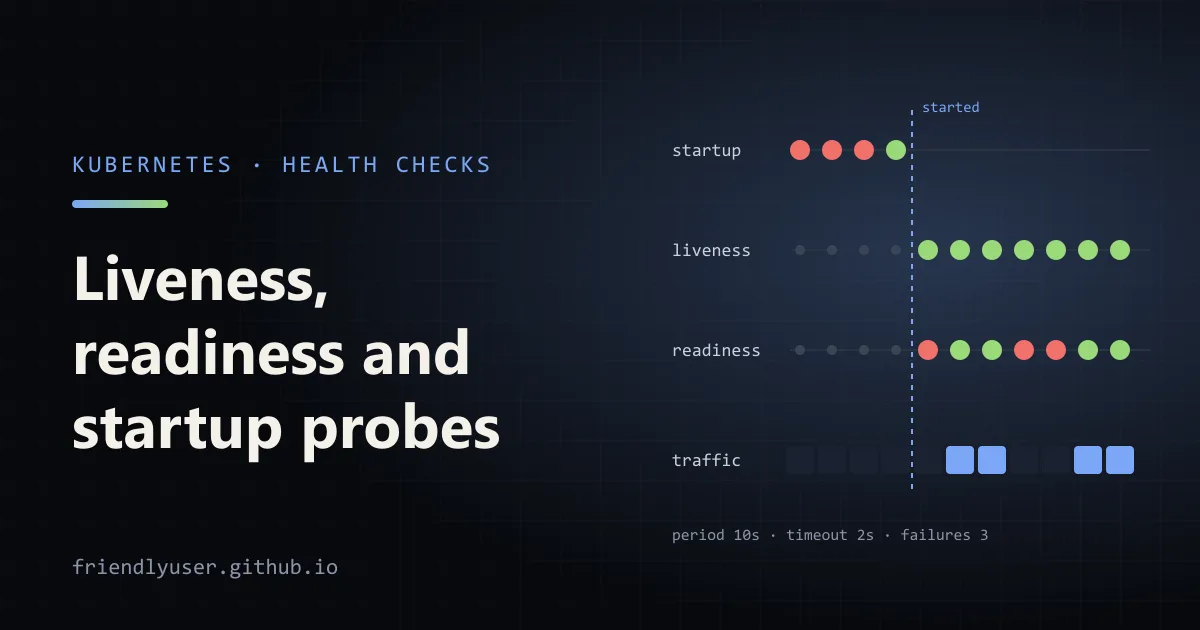
Kubernetes probes are periodic health checks that the kubelet runs against each container. Their results decide two things: whether a container gets restarted, and whether a pod receives traffic from its Services. Configured well, they let Kubernetes route around a pod that is warming up or temporarily overloaded, and restart one that is truly stuck. Configured badly, they cause the outages they’re meant to prevent.
There are three probes, and the most common mistake is treating them as interchangeable.
What each probe does
Section titled “What each probe does”| Probe | Question it answers | What happens on failure |
|---|---|---|
| Startup | Has the app finished starting? | Container is killed and restarted per restartPolicy |
| Liveness | Is this process still working? | Container is killed and restarted |
| Readiness | Should this pod get traffic right now? | Pod is removed from Service endpoints; not restarted |
Readiness runs for the container’s whole life. While it fails, the pod is marked not ready and taken out of the EndpointSlices behind every Service that selects it, so no new requests are routed to it. When it passes again, the pod goes back in. Readiness also gates rolling updates: a Deployment counts unready pods as unavailable, so a new version that never becomes ready stalls the rollout instead of replacing all the old pods.
Liveness exists for one situation: the process is running but will never recover by itself. Think of a deadlock, or an event loop stuck on a blocking call. Restarting is the only fix, and liveness automates it.
Startup protects slow starters from liveness. Until the startup probe succeeds, liveness and readiness probes are not run at all. Once it succeeds, it never runs again for that container. Startup probes have been stable since Kubernetes 1.20.
If you define no probes, Kubernetes treats the container as live while the process runs and as ready as soon as it starts. For a web app, that means traffic arrives before it can serve it.
The four ways to check
Section titled “The four ways to check”Every probe uses one of four mechanisms:
# HTTP: success is any status from 200 to 399httpGet:  path: /readyz  port: http            # a named container port or a number  httpHeaders:    - name: X-Probe      value: kubelet
# TCP: success is an accepted connectiontcpSocket:  port: 6379
# Command inside the container: success is exit code 0exec:  command: ["redis-cli", "ping"]
# gRPC health checking protocol: success is SERVINGgrpc:  port: 9090            # must be a number; named ports are not supported  service: orders       # optional, sent as the service name in the request
Some details that matter in practice:
- The kubelet runs the probe, from the node, against the pod’s IP. An HTTP probe sends
User-Agent: kube-probe/<version>, which helps if you want to filter probe requests out of access logs. tcpSocketonly proves a port is open. A wedged app whose listener still accepts connections passes. PreferhttpGetorgrpcwhen the app can answer a real request.execstarts a process on every check. With many pods and short periods, that adds up to real CPU on the node. It’s the right choice for things like databases that ship a CLI health command, and a poor choice when an HTTP endpoint would do.grpcprobes (stable since Kubernetes 1.27) need the app to implement the standardgrpc.health.v1.Healthservice. Most gRPC frameworks include one.
The timing fields
Section titled “The timing fields”All three probes share the same timing fields. These are the defaults:
| Field | Default | Meaning |
|---|---|---|
initialDelaySeconds | 0 | Wait before the first check |
periodSeconds | 10 | Time between checks |
timeoutSeconds | 1 | How long a single check may take before it counts as failed |
failureThreshold | 3 | Consecutive failures before the probe is considered failed |
successThreshold | 1 | Consecutive successes to count as passing again (must be 1 for liveness and startup) |
Two calculations are worth doing for every probe you write:
- Time to act ≈
periodSeconds × failureThreshold. With the defaults, a hung container is restarted roughly 30 seconds after it stops answering. - Startup budget =
periodSeconds × failureThresholdof the startup probe. That’s the longest the app may take to start before Kubernetes gives up and restarts it.
timeoutSeconds: 1 is the default that bites most often. A healthy app under load, or one in the middle of a garbage collection pause, can take longer than a second to answer. One slow response isn’t a failure by itself, but three in a row restart the container. Give probes a timeout of a few seconds and keep the endpoints cheap.
The classic mistake: liveness that checks dependencies
Section titled “The classic mistake: liveness that checks dependencies”It’s tempting to write one /health endpoint that checks the database, the cache and a downstream API, and use it for both liveness and readiness. Follow what happens when the database has a 60-second blip:
- Every pod’s
/healthstarts failing at the same moment, because they all share that database. - After
failureThresholdchecks, the kubelet restarts every container. - They all start up at the same time, open new connection pools at the same time, and hammer the database just as it recovers.
- Restarts that keep failing turn into
CrashLoopBackOff, with growing delays between attempts, so the service stays down after the database is back.
Restarting your app does not fix someone else’s database. The rule:
- Liveness checks only the process itself. “Can I answer an HTTP request at all?” is usually enough.
- Readiness may check dependencies the pod truly can’t serve without. A pod that can’t reach its database being taken out of rotation is reasonable. But if all pods depend on the same database, they all go unready together and the Service has no endpoints. Decide whether serving errors quickly is better than refusing connections. Often it is, and readiness should check only local state.
- Never make liveness depend on another service.
Endpoints in the app
Section titled “Endpoints in the app”Here are two endpoints for a FastAPI service that follow those rules. /livez has no dependencies; /readyz reports not ready until a warm-up step finishes or if its own database check fails:
# app.py: liveness answers "is this process working?", readiness answers "should it get traffic?"import asynciofrom contextlib import asynccontextmanager
from fastapi import FastAPI, Response
state = {"warm": False}

async def warm_up() -> None:    await asyncio.sleep(2)  # stand-in for loading caches, models, config ...    state["warm"] = True

async def database_ok() -> bool:    try:        # Replace with a cheap query, e.g. SELECT 1, using its own short timeout.        await asyncio.wait_for(asyncio.sleep(0), timeout=0.5)        return True    except Exception:        return False

@asynccontextmanagerasync def lifespan(app: FastAPI):    task = asyncio.create_task(warm_up())    yield    task.cancel()

app = FastAPI(lifespan=lifespan)

@app.get("/livez")async def livez():    # No dependency checks: if the event loop can answer, the process is alive.    return {"status": "ok"}

@app.get("/readyz")async def readyz(response: Response):    if not state["warm"]:        response.status_code = 503        return {"status": "warming up"}    if not await database_ok():        response.status_code = 503        return {"status": "database unavailable"}    return {"status": "ready"}
You can watch the behaviour locally with FastAPI’s test client, which runs the lifespan:
# smoke.py: pip install "fastapi[standard]"import timefrom fastapi.testclient import TestClientfrom app import app
with TestClient(app) as c:    for i in range(4):        r1, r2 = c.get("/livez"), c.get("/readyz")        print(f"t={i}s livez={r1.status_code} readyz={r2.status_code} {r2.json()}")        time.sleep(1)
t=0s livez=200 readyz=503 {'status': 'warming up'}t=1s livez=200 readyz=503 {'status': 'warming up'}t=2s livez=200 readyz=200 {'status': 'ready'}t=3s livez=200 readyz=200 {'status': 'ready'}That’s the split you want: the process is alive the whole time, and it only asks for traffic once it can handle it. The database check has its own timeout, shorter than the probe’s, so a slow database makes the endpoint answer 503 rather than hang.
A sample Deployment
Section titled “A sample Deployment”apiVersion: apps/v1kind: Deploymentmetadata: name: orders-apispec: replicas: 3 selector: matchLabels: app: orders-api strategy: rollingUpdate: maxUnavailable: 0 maxSurge: 1 template: metadata: labels: app: orders-api spec: terminationGracePeriodSeconds: 30 containers: - name: api image: ghcr.io/example/orders-api:1.4.2 ports: - name: http containerPort: 8080 startupProbe: httpGet: path: /livez port: http periodSeconds: 5 failureThreshold: 30 # allows up to 150 s to start livenessProbe: httpGet: path: /livez port: http periodSeconds: 10 timeoutSeconds: 2 failureThreshold: 3 # restart after about 30 s of failures readinessProbe: httpGet: path: /readyz port: http periodSeconds: 5 timeoutSeconds: 2 failureThreshold: 2 # out of the Service after about 10 s lifecycle: preStop: exec: command: ["sleep", "5"] resources: requests: cpu: 100m memory: 128Mi limits: memory: 256MiNotes on the choices:
- The startup probe uses the liveness endpoint. It answers “has the server started?”, and once it passes, liveness takes over with a tighter budget. That’s better than an
initialDelaySeconds: 120on liveness, which delays failure detection for every start, including fast ones. - Readiness is checked more often than liveness, with a lower threshold, so traffic moves away from a struggling pod well before anything restarts it.
maxUnavailable: 0means a rollout never removes an old pod until a new one is ready. If the new version’s readiness never passes, the rollout stops with the old pods still serving.- The
preStopsleep covers the gap at shutdown. When a pod starts terminating, it’s removed from the endpoints, but load balancers and kube-proxy on other nodes take a moment to notice. Sleeping a few seconds before the container getsSIGTERMlets in-flight routing catch up. This form needs asleepbinary in the image; newer Kubernetes versions also have a built-insleepaction forpreStopthat doesn’t.
Debugging probe failures
Section titled “Debugging probe failures”Probe failures show up as events on the pod:
kubectl describe pod orders-api-7d9c6b5f4-x2k8p # Events section at the bottomkubectl get events --field-selector reason=Unhealthykubectl get pod orders-api-7d9c6b5f4-x2k8p -o jsonpath='{.status.containerStatuses[0].restartCount}'A failing liveness probe produces Unhealthy events with the HTTP status or the timeout error, followed by a Killing event saying the container will be restarted. If restartCount climbs steadily while the logs show nothing wrong, look at the probe before the app: a timeout that is too short is the usual cause.
To see what the kubelet sees, call the endpoint from inside the pod (kubectl exec ... -- wget -qO- localhost:8080/readyz) or port-forward and use curl.
Gotchas
Section titled “Gotchas”- Don’t point liveness at an endpoint that does real work. If
/livezrenders a page or queries a database, liveness will fail under exactly the load where you least want restarts. - Readiness failing on every pod at once leaves the Service with no endpoints. Clients get connection errors rather than your app’s error responses.
- Restarts don’t fix memory leaks for long. If liveness restarts a container every few hours, the probe is hiding a bug. Look at the memory graph.
- Probe-level
terminationGracePeriodSecondscan be set on liveness and startup probes to kill a failing container faster than the pod’s normal shutdown grace period. It can’t be set on readiness probes. - Sidecars have their own probes. A pod is ready only when all its containers are ready, so a sidecar with a bad readiness probe takes the whole pod out of rotation.
Further reading
Section titled “Further reading”© 2026 David Li · Home · Blog · RSS ·Classic site · Built with Astro, Starlight and three.js · Logos:Font Awesome Free (CC BY 4.0)