Tracing a Python Web Service with OpenTelemetry and Jaeger
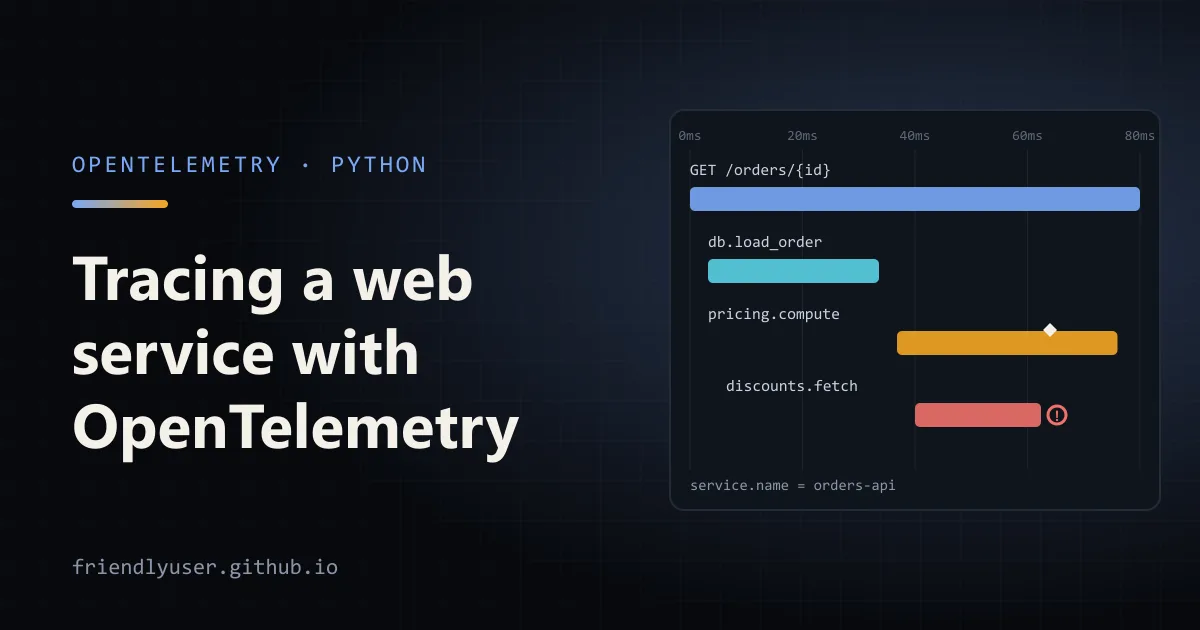
A trace records one request’s path through your code as a tree of timed spans: the HTTP handler, the database query inside it, the call to another service inside that. When a request is slow or fails, the trace shows where the time went and which step broke, which logs and averaged metrics can’t tell you.
OpenTelemetry (OTel) is the vendor-neutral standard for producing that data. You instrument your code once with the OTel SDK and send spans over the OTLP protocol to whichever backend you like: Jaeger, Grafana Tempo, Honeycomb, Datadog and others all accept it. This post instruments a small FastAPI service and views its traces in Jaeger. Examples were run with Python 3.12, opentelemetry-sdk 1.44.0 and opentelemetry-instrumentation-fastapi 0.65b0.
The moving parts
Section titled “The moving parts”Five terms cover most of the API:
- TracerProvider: the SDK object that creates tracers and owns the processing pipeline. You set one per process.
- Resource: attributes describing the process that produced the spans.
service.nameis the important one, since backends group traces by it. - Tracer: what your code uses to start spans, usually one per module or library.
- Span processor: decides when finished spans are handed on.
BatchSpanProcessorbuffers them and exports from a background thread, which is what you want in production. - Exporter: sends spans somewhere.
OTLPSpanExporterspeaks OTLP;ConsoleSpanExporterprints JSON to stdout, which is handy while setting up.
Instrumentation libraries (opentelemetry-instrumentation-*) create spans for frameworks and clients you don’t control: FastAPI, Flask, Django, requests, httpx, SQLAlchemy, psycopg and many more.
Start Jaeger
Section titled “Start Jaeger”Jaeger v2 accepts OTLP directly, so a single container is the whole backend for local work:
docker run --rm --name jaeger \ -p 16686:16686 \ -p 4317:4317 \ -p 4318:4318 \ jaegertracing/jaeger:latestPort 16686 is the web UI, 4317 is OTLP over gRPC and 4318 is OTLP over HTTP. The container keeps traces in memory, so they disappear when it stops. That’s fine for development. For anything you keep around, pin a specific 2.x tag instead of latest.
Instrument a FastAPI app
Section titled “Instrument a FastAPI app”Install the packages:
pip install "fastapi[standard]" \ opentelemetry-sdk \ opentelemetry-exporter-otlp-proto-http \ opentelemetry-instrumentation-fastapiThe OpenTelemetry Python packages are versioned in two lines: the API, SDK and exporters are 1.x, while the instrumentation packages are 0.x “beta” releases that move in lockstep with them (SDK 1.44.0 pairs with instrumentation 0.65b0). If you pin versions, pin them as a matching set.
Here is the whole service. It has an orders endpoint that loads an order, prices it, and calls a discount lookup that always times out, so there’s something interesting in the trace:
import osimport randomimport time
from fastapi import FastAPI, HTTPExceptionfrom opentelemetry import tracefrom opentelemetry.exporter.otlp.proto.http.trace_exporter import OTLPSpanExporterfrom opentelemetry.instrumentation.fastapi import FastAPIInstrumentorfrom opentelemetry.sdk.resources import Resourcefrom opentelemetry.sdk.trace import TracerProviderfrom opentelemetry.sdk.trace.export import BatchSpanProcessor, ConsoleSpanExporterfrom opentelemetry.trace import Status, StatusCode
# Who is sending the spans: shows up as the service name in Jaeger.resource = Resource.create({"service.name": "orders-api", "service.version": "0.1.0"})provider = TracerProvider(resource=resource)# Sends to http://localhost:4318/v1/traces unless OTEL_EXPORTER_OTLP_ENDPOINT says otherwise.provider.add_span_processor(BatchSpanProcessor(OTLPSpanExporter()))if os.getenv("TRACE_TO_CONSOLE"):    provider.add_span_processor(BatchSpanProcessor(ConsoleSpanExporter()))trace.set_tracer_provider(provider)
tracer = trace.get_tracer("orders-api")app = FastAPI()ORDERS = {1: {"id": 1, "items": ["book", "pen"]}}

def load_order(order_id: int) -> dict | None:    with tracer.start_as_current_span("db.load_order") as span:        span.set_attribute("order.id", order_id)        time.sleep(random.uniform(0.01, 0.05))  # stand-in for a real query        return ORDERS.get(order_id)

def fetch_discount(order_id: int) -> float:    with tracer.start_as_current_span("discounts.fetch"):        time.sleep(0.01)        raise TimeoutError("discount service timed out")

def price_order(order: dict) -> float:    with tracer.start_as_current_span("pricing.compute") as span:        span.set_attribute("order.item_count", len(order["items"]))        total = 9.99 * len(order["items"])        try:            total -= fetch_discount(order["id"])        except TimeoutError as exc:            # Handled: the request still succeeds, but the trace shows what happened.            span.add_event("discount skipped", {"reason": str(exc)})        return round(total, 2)

@app.get("/orders/{order_id}")def get_order(order_id: int):    order = load_order(order_id)    if order is None:        trace.get_current_span().set_status(Status(StatusCode.ERROR, "order not found"))        raise HTTPException(status_code=404, detail="order not found")    return {**order, "total": price_order(order)}

@app.get("/healthz")def healthz():    return {"ok": True}

FastAPIInstrumentor.instrument_app(app, excluded_urls="healthz", exclude_spans=["receive", "send"])
Run it and send a few requests:
uvicorn app:app --port 8000curl localhost:8000/orders/1 # {"id":1,"items":["book","pen"],"total":19.98}curl localhost:8000/orders/7 # 404curl localhost:8000/healthz # not tracedOpen http://localhost:16686, pick orders-api in the Service list and click Find Traces. The /orders/1 trace shows a GET /orders/{order_id} span with db.load_order and pricing.compute nested inside it, and discounts.fetch nested inside the pricing span, marked as an error.
What the setup code does
Section titled “What the setup code does”Order matters at the top of the file: the provider has to be registered with trace.set_tracer_provider before anything asks for a tracer. If you forget it, the API falls back to a no-op provider and every span silently goes nowhere.
FastAPIInstrumentor.instrument_app wraps the app in ASGI middleware that starts a SERVER span for every request. It names the span after the route template (GET /orders/{order_id}), not the concrete URL, which keeps the number of distinct span names small. It also reads any incoming traceparent header, so if the caller is traced too, this request joins the caller’s trace instead of starting a new one.
Two options trim noise:
excluded_urlstakes a comma-separated list of regexes. Health checks and metrics scrapes are the usual candidates, since they add thousands of traces of nothing.exclude_spans=["receive", "send"]drops the internal ASGI spans the instrumentation otherwise creates for each message, such asGET /orders/{order_id} http send. They are rarely useful in an API.
Manual spans, attributes and events
Section titled “Manual spans, attributes and events”The instrumentation gives you one span per request. The spans inside it, which tell you which part of the handler was slow, come from your own code:
with tracer.start_as_current_span("db.load_order") as span: span.set_attribute("order.id", order_id) ...start_as_current_span creates a child of whatever span is current, makes the new span current for the with block, and ends it on exit. That parent-child chain is what turns separate spans into a tree, and it’s carried in Python’s contextvars, so it works across async code without passing anything around.
Attributes are key-value pairs you can search and filter on in the backend: IDs, sizes, flags. Values must be strings, booleans, numbers or lists of those. Where a standard name exists in the semantic conventions (http.request.method, db.system.name and so on), use it, so that backends recognise it.
The HTTP instrumentations still emit the older attribute names (http.method, http.status_code) by default, as you’ll see in the output below. Setting OTEL_SEMCONV_STABILITY_OPT_IN=http switches them to the stable names (http.request.method, http.response.status_code, url.path).
Events are timestamped log lines attached to a span. span.add_event("discount skipped", {...}) marks the moment something happened without creating a whole child span for it.
Errors
Section titled “Errors”If an exception escapes a start_as_current_span block, the SDK records it as an exception event and sets the span status to ERROR. You don’t need to do anything. That’s why discounts.fetch shows up red even though the caller handled the timeout.
When you catch an error and decide the request has failed anyway, set the status yourself, as the 404 branch does: by default the FastAPI instrumentation leaves 4xx responses with an unset status, following the HTTP semantic conventions, because a 404 is often the client’s mistake rather than the server’s. If you catch an exception and want its stack trace in the span, call span.record_exception(exc).
Seeing spans without a backend
Section titled “Seeing spans without a backend”Set TRACE_TO_CONSOLE=1 and the second processor prints every finished span as JSON. This is the trimmed server span from the 404 request:
{ "name": "GET /orders/{order_id}", "kind": "SpanKind.SERVER", "parent_id": null, "status": { "status_code": "ERROR", "description": "order not found" }, "attributes": { "http.method": "GET", "http.route": "/orders/{order_id}", "http.status_code": 404 }, "resource": { "attributes": { "service.name": "orders-api", "service.version": "0.1.0" } }}When nothing is listening on port 4318, the OTLP exporter logs a connection error from its background thread and drops the batch. Your requests are not affected, which is the behaviour you want in production too.
Calling other services
Section titled “Calling other services”A trace becomes much more useful once it crosses service boundaries. To propagate context on outgoing HTTP calls, instrument the client library. For httpx:
# pip install opentelemetry-instrumentation-httpxfrom opentelemetry.instrumentation.httpx import HTTPXClientInstrumentor
HTTPXClientInstrumentor().instrument()
Every httpx request then gets a CLIENT span and a W3C traceparent header. If the downstream service is instrumented too, its spans appear in the same trace in Jaeger. There are equivalent packages for requests, aiohttp and urllib3.
Configuration by environment variable
Section titled “Configuration by environment variable”The SDK reads standard OTEL_* variables, so the same code can point at different backends per environment:
export OTEL_EXPORTER_OTLP_ENDPOINT=http://otel-collector:4318export OTEL_TRACES_SAMPLER=parentbased_traceidratioexport OTEL_TRACES_SAMPLER_ARG=0.1 # keep 10% of new tracesThe parentbased_ sampler follows the caller’s decision when there is a parent span, so a trace isn’t half-sampled across services.
There is also a zero-code route. opentelemetry-instrument sets up the provider and every installed instrumentation before your app starts:
pip install opentelemetry-distro opentelemetry-exporter-otlp-proto-httpopentelemetry-bootstrap -a install # installs instrumentations for the libraries it findsOTEL_SERVICE_NAME=orders-api \OTEL_TRACES_EXPORTER=otlp_proto_http \OTEL_METRICS_EXPORTER=none OTEL_LOGS_EXPORTER=none \opentelemetry-instrument uvicorn app:appThat gives you request and client spans without touching the code. You still use trace.get_tracer(...) for manual spans. Don’t combine it with the explicit setup above in the same process, or you’ll configure two providers.
Gotchas
Section titled “Gotchas”- Forking servers.
BatchSpanProcessorexports from a background thread, and threads don’t survivefork(). With Gunicorn’s--preload, or anything else that forks after setup, initialise the provider in each worker, such as in a Gunicornpost_forkhook. The OTel Python docs have a page on fork process models. - Short-lived scripts. Spans are exported in batches. A CLI or a batch job that exits immediately can lose the last batch; call
provider.shutdown()(orforce_flush()) before exiting. - Span names should be low-cardinality.
GET /orders/{order_id}, notGET /orders/123. Put the ID in an attribute. - Attributes are stored and shipped. Don’t put passwords, tokens or personal data in them, and remember that some instrumentations can capture headers if you enable it.
- In production, send to a Collector. Exporting straight to Jaeger is fine locally. In production, run an OpenTelemetry Collector next to your services and point the SDK at it, so batching, retries, sampling and the choice of backend live in one config instead of in every app.
Further reading
Section titled “Further reading”© 2026 David Li · Home · Blog · RSS ·Classic site · Built with Astro, Starlight and three.js · Logos:Font Awesome Free (CC BY 4.0)